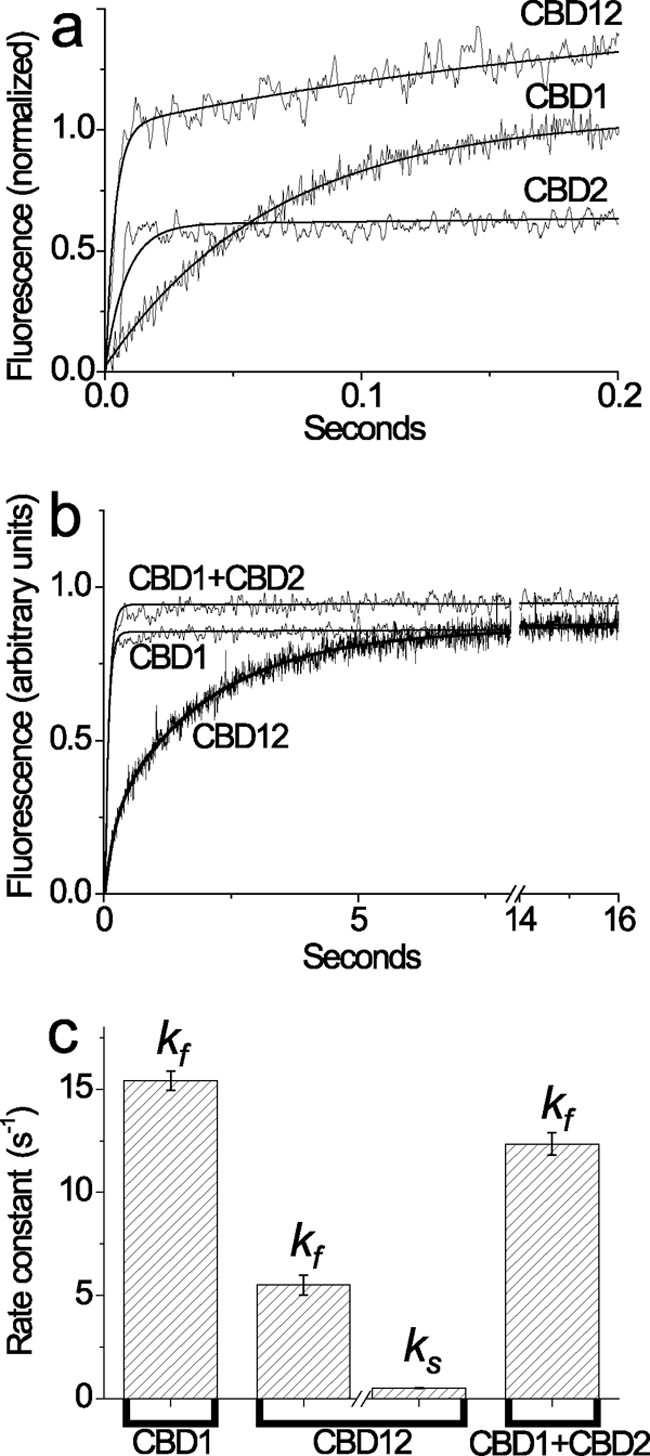
FIGURE 2.

Stopped flow kinetics of Ca2+ dissociation from the high affinity sites of CBD1, CBD2, CBD12, and CBD1 + CBD2. All buffer solutions were prepared on the basis of 10 mm Tris-HCl, pH 7.2, 100 mm KCl (TK buffer) at 25 °C. a, syringe 1 contained 20 μm CBD12, CBD1, or CBD2 with 80 μm free Ca2+, and syringe 2 contained 153 μm Quin-2. 150-μl aliquots from syringe 1 were mixed with the identical volume of Quin-2 buffer in syringe 2. The representative trace of CBD12 was fitted to a double exponential curve with kr = 280 ± 32 s−1 and kf = 4.5 ± 0.19 s−1, whereas the traces of CBD1 and CBD2 were fitted to a single exponential curve with kf = 15.2 ± 0.15 s−1 and kr = 123.6 ± 4.42 s−1, respectively. b, syringe 1 contained either CBD1, CBD12, or CBD1 + CBD2 (10 μm of each protein) in TK buffer with 10 μm free Ca2+, and syringe 2 contained 200 μm Quin-2 buffer. 150-μl aliquots from syringe 1 were mixed with an identical volume of Quin-2 buffer from syringe 2 to decrease [Ca2+] below 7 nm (see “Materials and Methods”). The representative traces of CBD1 or CBD1 + CBD2 were fitted to a single exponential curve with kf = 14.8 ± 0.07 s−1 and kf = 13.1 ± 0.07 s−1, respectively. The representative trace of CBD12 was fitted to a double exponential curve with kf = 5.2 ± 0.08 s−1 and ks = 0.52 ± 0.001 s−1. c, the bars represent the statistics of experimentally observed kf and ks values (see above, a and b) obtained in four to seven independent experiments performed with three different preparations of CBD1, CBD2, CBD12, or CBD1 + CBD2 proteins. All of the measured values represent the means ± S.E.
