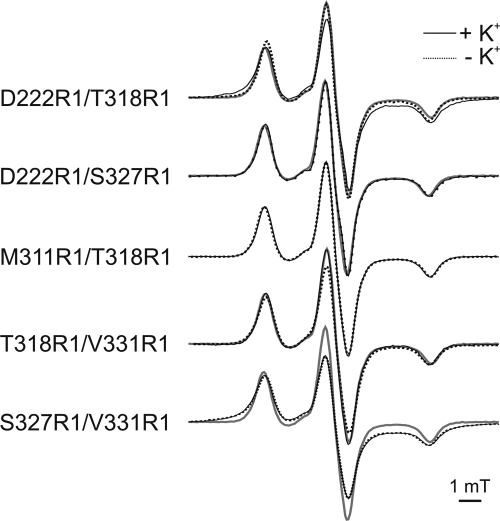
FIGURE 6.
Low temperature (160 K) cw EPR spectra of double labeled reconstituted KtrB variants in the absence and in the presence of K+. Comparison of the observed EPR spectra in the presence (solid black lines) and in the absence of K+ (dotted gray lines), respectively. The EPR spectrum of Met-311R1/Thr-318R1 is represented by a solid gray line in comparison with each double mutant to visualize dipolar broadening. All spectra are spin-normalized.

