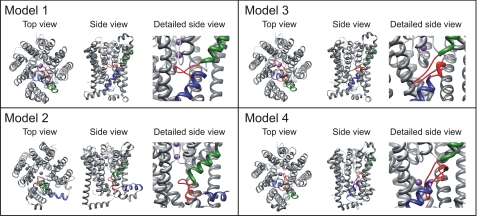
FIGURE 8.
Schematic representation of different KtrB models. Models 1 and 2 are taken from Ref. 11. In model 1, m2C1 and M2C3 span the membrane together, and M2C2 forms a loop inside the protein. In model 2, m2C1 and M2C2 span the membrane, and M2C3 lies as an α-helix on the cytoplasmic surface of the membrane. Models 3 (closed structure) and 4 (open structure) are based on model 1, taking into account the measured distances between double spin-labeled residues in the presence and absence of K+ ions, respectively (Table 1). Regions M2C1 and M2C3 are highlighted in green and blue, respectively, the linker region M2C2 in red, and two potassium ions in purple. The top view is taken from the periplasm. In the side views, the top and bottom represent the periplasm and cytoplasm, respectively. For the detailed side view of M2C, residues 216–244 of regions M2B to M1C are removed.

