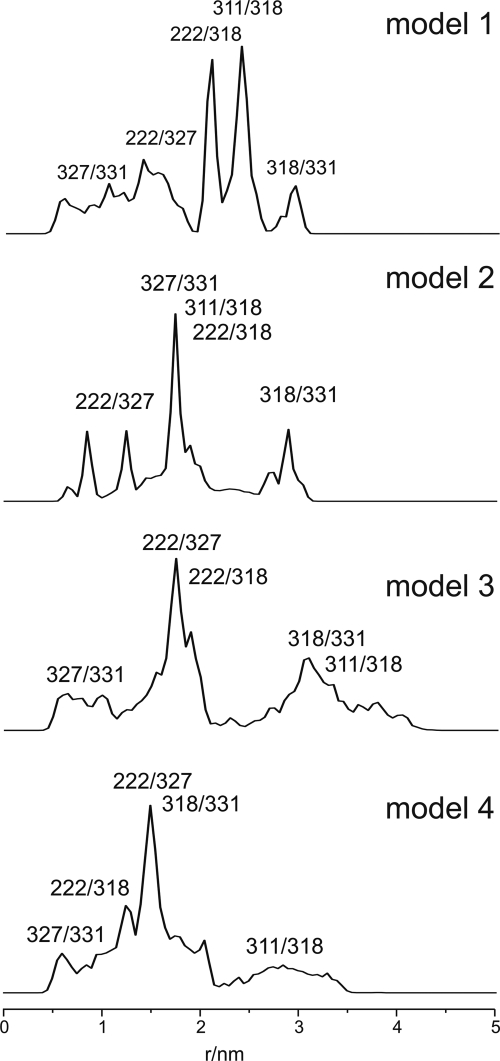
FIGURE 9.
Simulated interspin distance distributions of different KtrB models using the rotamer library approach (38). Residue numbers indicate the spin label pair that contributes to the calculated distance distribution. See Table 1 for the measured distances. Models 1–4 are described under “Results, rotamer library analysis for different K to B models” and in the legend to Fig. 8.

