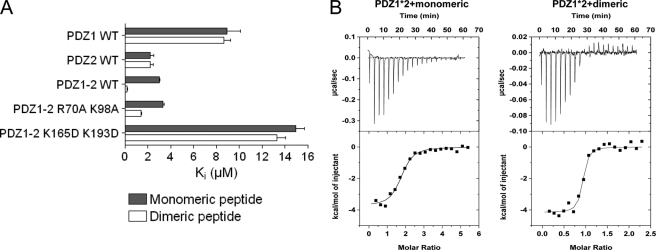
FIGURE 2.
Equilibrium binding experiments. A, Ki values for PDZ-peptide interactions measured from fluorescence polarization displacement experiments. Error bars were calculated from the average of three independent measurements. B, ITC data for PDZ1–2* with monomeric peptide inhibitor and dimeric inhibitor at 10 °C. Top, raw data. Bottom, integrated titration curves. Fitting of a single site model (solid line) yielded the parameters reported in Table 1.

