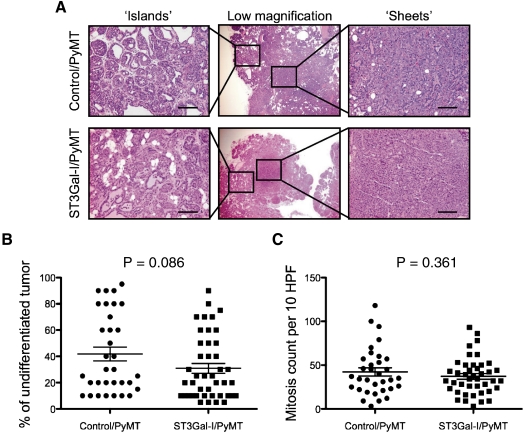
Fig. 6.
Morphology of tumors from ST3Gal-I/PyMT and Control/PyMT. (A) H&E staining of tumors from ST3Gal-I/PyMT mice and Control/PyMT showing areas of differentiation “islands of cell” and undifferentiation “sheets” of cells. Bars: 25 μm. (B) The percentage of undifferentiation in the sections of the tumors analyzed was estimated, each dot represents an individual tumor, ST3Gal-I/PyMT n = 42, Control/PyMT n = 33. (C) Mitotic count per 10 high-power fields (HPF), ST3Gal-I/PyMT n = 42, Control/PyMT n = 33

