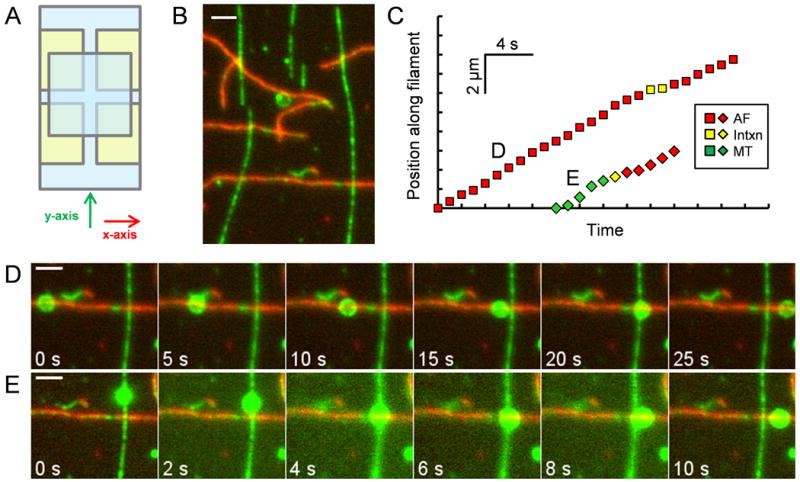
Figure 1.

Crossed-flow-path sample chamber and representative time series of beads traversing intersections. (A) Four pieces of double-sided adhesive tape (yellow) hold two cover slips (blue) together to make two perpendicular (x and y) 3 mm wide flow paths. (B) Image of rhodamine-biotin-labeled microtubules and Alexa 647-rhodamine-biotin-labeled actin filaments bound to the cover slip of a crossed-path flow chamber. The microtubules (green) serve as “underpasses,” and actin filaments (red) serve as “overpasses.” The opposite geometry was also tested in some experiments. (C) Distance vs. time plot for the two beads shown in (D) and (E). Yellow symbols indicate pausing at the intersection. (D) Time series of a rhodamine-labeled bead that starts on an AF, encounters a MT, “passes,” and exits on the AF. (E) Time series of a bead that starts on a MT, “switches” at the intersection, and exits on an AF. Scale bars represent 2 μm. See also Movies S1 and S2.
