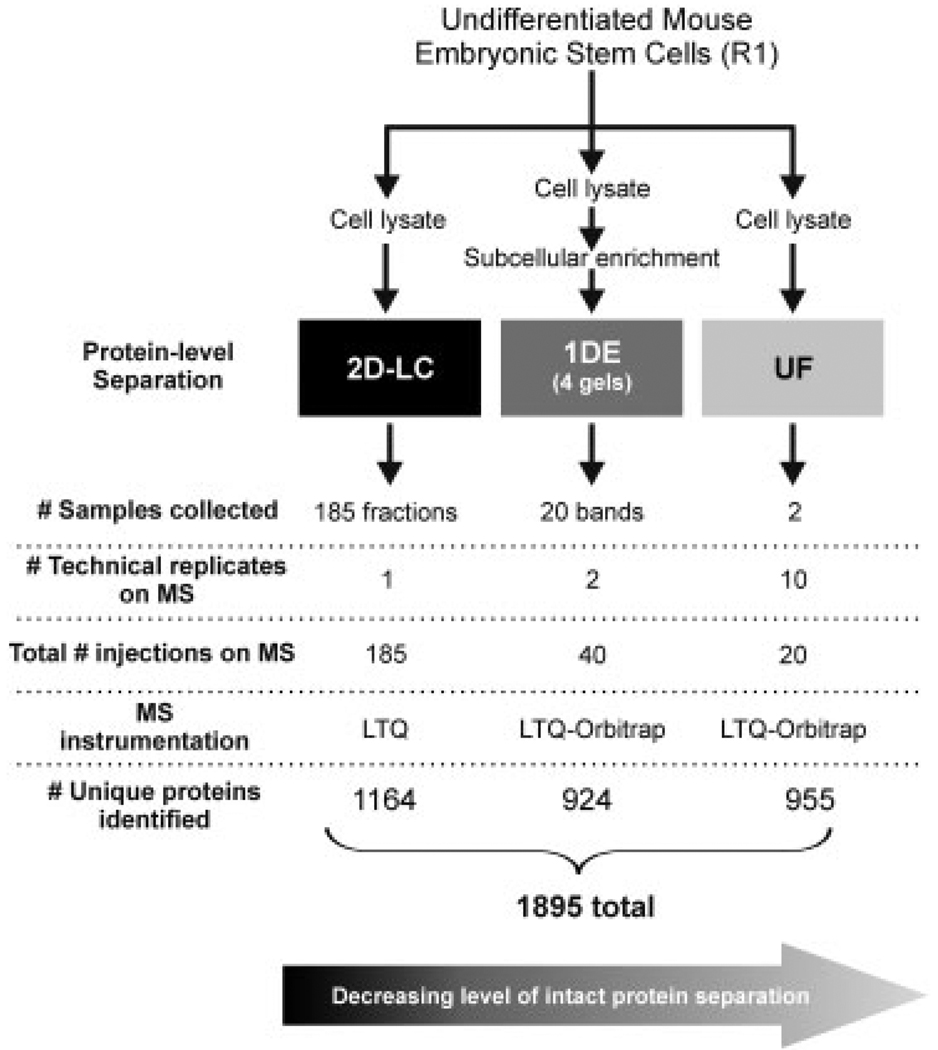
Figure 1.
Experimental workflow. Listed are the number of fractions the technique resulted in (# samples collected), number of times each digested fraction was analyzed independently by mass spectrometry (# technical replicates), multiplying # samples × # replicates = total number samples run on MS, MS instrumentation used to analyze that particular sample, and # unique proteins identified by that platform which were identified by 2 or more unique peptide sequences with a protein probability > 0.9

