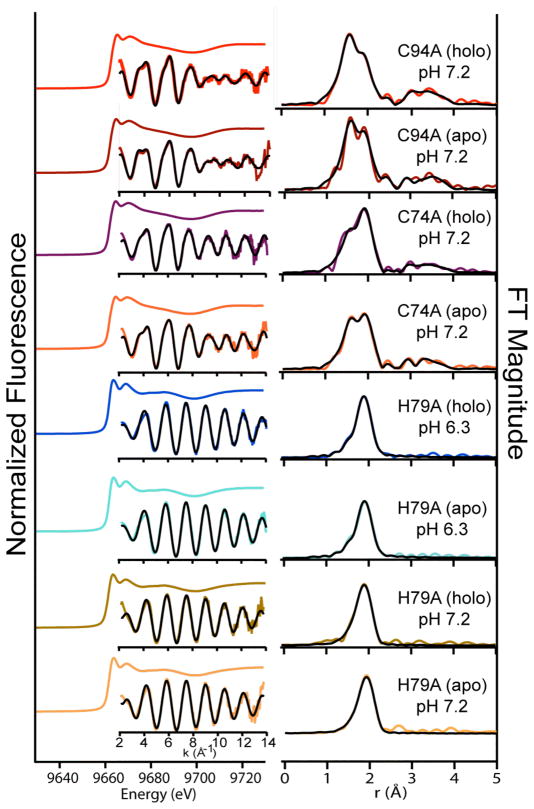
Figure 6.
Zinc K-edge XAS data for selected mutant HypA proteins. Left: Normalized XANES spectra with unfiltered k3-weighted EXAFS spectra (colored line) and best fits (black line) from Table 2 inset. Right: Fourier-transformed EXAFS spectra and fits. Data for other Cys → Ala, Cys → Asp and H95A are shown in supporting information.

