Abstract
Hyperpolarized (HP) 3He MRI is an emerging tool in the diagnosis and evaluation of pulmonary diseases involving bronchoconstriction, such as asthma. Previously, airway diameters from dynamic HP 3He MR images of the lung were assessed manually and subjectively, and were thus prone to uncertainties associated with human error and partial volume effects. A model-based algorithm capable of fully utilizing pixel intensity profile information and attaining subpixel resolution has been developed to measure surrogate airway diameters from HP 3He MR static projection images of plastic tubes. This goal was achieved by fitting ideal pixel intensity profiles for various diameter (6.4 to 19.1 mm) circular tubes to actual pixel intensity data. A phantom was constructed from plastic tubes of various diameters connected in series and filled with water mixed with contrast agent. Projection MR images were then taken of the phantom. The favorable performance of the model-based algorithm compared to manual assessment demonstrates the viability of our approach. The manual and algorithm approaches yielded diameter measurements that generally stayed within 1× the pixel dimension. However, inconsistency of the manual approach can be observed from the larger standard deviations of its measured values. The method was then extended to HP 3He MRI, producing encouraging results at tube diameters characteristic of airways beyond the second generation, thereby justifying their application to lung airway imaging and measurement. Potential obstacles when measuring airway diameters using this method are discussed.
I. INTRODUCTION
Hyperpolarized (HP) 3He magnetic resonance imaging (MRI) is an emerging imaging modality for the diagnosis and evaluation of many lung diseases. One such application is the measurement of airway diameters in asthmatics, which could identify the specific airways affected and quantify the change in airway caliber, both during the onset of bronchoconstriction symptoms and following treatment. Previously, diameters of airways imaged with HP 3He MRI were measured subjectively, with a person manually identifying the borders of the airways. This approach is prone to human error. A new, robust, and automated diameter measurement approach has been developed to essentially eliminate the uncertainties of the manual approach and is described and discussed in this paper.
II. BACKGROUND
A. Asthma
Asthma is a chronic pulmonary disease characterized by the hyper-reactivity, inflammation, and reversible heterogeneous constriction of the respiratory airways. The American Thoracic Society estimates that asthma affects 20 million Americans today, with total cost (direct and indirect) associated with asthma expected to exceed $16.1 billion.1 Among the information that remains unknown about asthma is the actual magnitude and distribution of airway constriction in asthmatics. Statistical distributions of airway constriction magnitude have been inferred from matching simulation-computed lung resistance and elastance values to actual lung mechanics measurements.2,3 These predictions do not identify the specific airways affected or their levels of constriction, and thus are also incapable of determining the effectiveness of bronchodilators as well as which airways benefit from treatment.
The respiratory airway tree has long been modeled as consisting of a network of airways wherein each parent airway bifurcates into two children airways. The morphometric description of the airway tree is such that each parent airway starts off as relatively straight and near-circular. Approaching the bifurcation location, the circular cross section becomes more elliptic, and eventually splits into two smaller elliptic cross sections. Finally, away from the bifurcation, the children airways regain near-circular cross sections.4,5 Even if some morphometric studies do not explicitly state that airways are circular in cross section, their measurement of airway diameters imply this mindset.6 However, histologic sections of porcine bronchi have shown that actual airways, especially bronchoconstricting ones, are not exactly circular in cross section.7 Even nonconstricting human airways, as measured from CT scans, reveal that at least for the first 8 airway generations, the major airway diameter is consistently larger than the minor airway diameter by 27.6%.8 Nevertheless, conceptualizing airways as circular in cross section, with the available flow area completely defined by a cross-sectional diameter, provides a framework in which airway caliber can be easily quantified and communicated.
B. Quantification of airway diameter from medical imaging
Medical imaging has the potential for corroborating the distribution of airway narrowing predicted by lung mechanics simulations, pinpointing the airways involved, and quantifying each airway’s degree of constriction. The greatest advantage of medical imaging, aside from the ability to resolve detailed anatomic information, lies in its minimally invasive nature. The current gold standard in the imaging of airways is computed tomography (CT). High-resolution CT (HRCT) has arguably the best spatial resolution in clinical practice,9 acquiring axial sections of the human body with 512 × 512 matrix, 1–3 mm slice thickness, and with in-plane resolutions down to 0.25 mm. HRCT has been used extensively in the study of asthmatic airways. It was instrumental in demonstrating that airway narrowing in methacholine-challenged healthy subjects is similar to that in asthmatics,10 and in identifying that abnormal excitation mechanisms in the smooth muscles of asthmatics may be responsible for their inability to distend the airways after a deep inspiration.11 It has also been used in animal studies12 and investigations on airway wall thickness and remodeling.13-16
Several approaches were developed for evaluating CT airway images. Manual and subjective methods for determining airway wall thickness and lumenal area include the use of electronic calipers on magnified images13,14 and the digitization of hand-traced feature boundaries.15,17,18 Computerized and/or automated techniques for identifying feature boundaries apply either the full-width half-maximum method,10-12,19 popularized by the volumetric image display and analysis software, or the score-guided erosion of offset images18 in the computed tomographic airway morphometry algorithm. However, score-guided erosion of offset images requires the user to iteratively select thresholds at which to carry out the operation, and despite that the full-width half-maximum approach is intuitive and widely accepted, the assignment of feature borders to where the pixel intensity is at 50% of the maximum is undeniably arbitrary. Finally, the window levels and widths set for visualizing CT airway images are selected depending on the perceived airway contrast, and vary from study to study.
HP 3He MRI is an imaging modality with great clinical potential for evaluating lung physiology and diagnosing respiratory diseases.20 Instead of using the proton MR signal from the water within human tissues, HP 3He MRI employs the signal from HP 3He. To overcome the low thermal equilibrium polarization of 3He, this noble gas isotope is hyperpolarized by collisional spin-exchange with optically pumped rubidium vapor. The polarization achieved using optical pumping can reach five orders of magnitude greater than the thermal equilibrium value. The frequency range at which the MRI system operates can be adjusted to that for helium with either a broadband system or a heterodyne system. HP 3He MRI possesses at least one advantage over HRCT in the imaging of airways: repeated scans enabling the tracking of disease progress over time is feasible, not having to worry about subcellular damage that may be caused by the frequent use of ionizing radiation. Further-more, HP 3He MRI also gives information about lung ventilation function while CT does not.
The imaging of airways using HP 3He MRI has been demonstrated in animals21-23 and in humans.24-26 A representative HP 3He MR image of the human airways is presented in Fig. 1. In these studies, the only quantitative analysis of the airways visualized was the counting of distinguishable airway generations. In animal27 and human28,29 studies devoted to investigating asthma, the attention has been on the ventilation distribution resulting from airway constriction rather than the airway constriction itself. Lewis et al. first measured airway diameters from HP 3He MR images and suggested its use for quantifying airway constriction in asthmatics.30 Their method, implemented in MATLAB, involved manually pinpointing the end points of airway diameter segments, and computing the distance between the two points using the Pythagorean theorem. They were able to obtain airway diameters that are in good agreement of values predicted by the Weibel model,31 a popular airway anatomy model, for the trachea through the fifth generation airways.
Fig. 1.
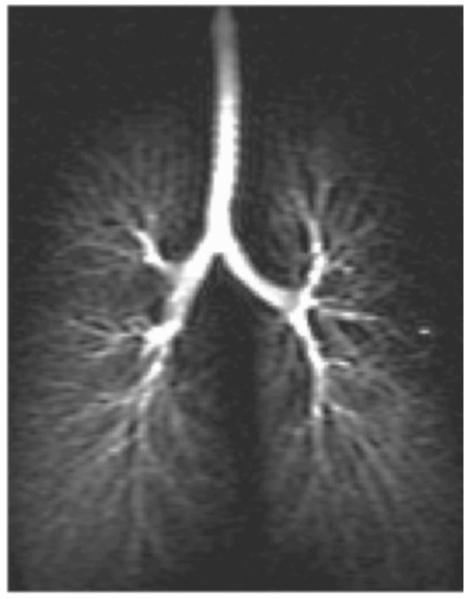
Representative hyperpolarized 3He MR image of the human airway tree.
Despite encouraging results, the technique employed by Lewis et al. lacked rigor. The human eye is not sensitive enough to identify which pixels contain the airway boundary as these may be much darker compared to pixels along the center of the airways. The significance of this problem increases with decreasing diameter. Fourth generation airways in the Weibel model have diameters of 4.5 mm, which is less than three times that of the 1.8 mm image resolution of the MR images acquired, and thus will not take more than four pixels to span. Each airway pixel the eye fails to identify will result in a considerable percentage error in the measured airway diameter. Even if two pixels that contain the two edges of an airway can be accurately identified, multiplying the pixel dimension by the number of pixels spanning the airway section will result in an overestimation of the airway diameter. This is because only a fraction of the edge voxels are occupied by the airway, and thus the full width of the boundary pixels should not be included in the airway-diameter estimate. Nonetheless, the appropriate fractional contribution of a boundary pixel to the diameter measurement cannot be determined by visual assessment.
To our knowledge, there has been no other work on developing diameter measurement techniques for airway images acquired using HP 3He MRI. However, model-based algorithms have been used to estimate blood vessel diameters from angiograms.32 X-ray attenuation across the blood vessels of interest and background tissue determine the projected intensity on the angiogram film. In that study, magnified projections of the films were digitized to produce images with 0.037 mm/pixel resolution. Instead of thinking of a circle as a set of points equidistant from the center, consider a line segment that is the diameter, and numerous pairs of points that are on the circle. Each point-pair defines a segment that is perpendicular to the diameter, and can then be thought of as the “thickness” of the circle at the corresponding position along its diameter. Vessel diameters were quantified by seeking the circle size that would produce an optimum fit between the intensity profile across the blood vessel section on the image, and profiles of discrete circle “thicknesses.” The use of discrete “thicknesses” along the profile for the purpose of fitting the image intensity data are straightforward for analog x-ray images, which essentially have infinitesimally fine image resolution. With the smallest investigated vessels on the order of 0.4 mm in diameter, the diameter-to-pixel ratio for angiogram vessel diameter measurements is at least 11. In contrast, for HP 3He MRI, the maximum diameter-to-pixel ratio offered by a typical adult trachea is 11 for an in-plane resolution of 1.8 mm, considering that the airway is about 20 mm in diameter. With such low diameter-to-pixel ratios, fitting the pixel intensity profiles of the airway with discrete circle thicknesses could lead to poor diameter estimates. Since pixel intensities are an integral of the signal from the corresponding voxel, as the diameter-to-pixel ratios of the HP 3He MR images’ airways further reduces, the profile of discrete thicknesses should deviate more and more from the profile of actual pixel intensities.
Due to the deficiencies associated with measuring diameters manually, and the imminent application of airway HP 3He MR imaging to asthmatic lungs, there is a need to develop a rigorous diameter quantification method, that has minimal dependence on human judgment and input, and is robust such that its ability to quantify airway diameters is not limited to certain orientations. Described here is the work in formulating a model-based algorithm that measures airway diameters, and preliminary lessons learned from its utilization on phantoms consisting of serpentine tubes filled with either 2.5% Magnevist solution or HP 3He.
III. METHODS
The experiment procedure and diameter measurement algorithm were formulated based on the assumption that the features of interest to be imaged with HP 3He MRI are circular tubes. To first order, the relationship between signal source volume within a voxel V and the imaged signal G should follow
| (1) |
where k is some constant of proportionality. dc bias of the pixel intensities due to noise are negligible33,34 as the SNR of the features all exceed 10, and will thus be ignored unless later measurements prove otherwise.35
A. Tubes phantom
Plastic tubing segments of nominal internal diameters ¾ in. (19.1 mm), ⅝ in. (15.9 mm), ½ in. (12.7 mm), ⅜ in. (9.5 mm), and ¼ in. (6.4 mm), corresponding to tube indices 1 through 5, respectively, were connected in series using tubing connectors. The connected tubing segments were then secured onto a modified test tube rack, with each tubing size having at least 3 cm of straight length approximately parallel to the rack grid. At both ends of the connected tubing segments, additional tubing and connectors were appended to permit the capping of the ends, and to enable attachment of a 150 ml glass syringe.
B. Imaging hardware
A 1.5-T MR imaging system (Signa LX, software version 8.4; GE Medical Systems, Milwaukee, WI) was used, with a flexible quadrature wrap-around lung coil (Clinical MR Solutions, Brookfield, WI) tuned to the 3He frequency. A heterodyne system was added to enable signal acquisition at the 3He frequency. A 3He polarizer built in-house was used to hyperpolarize the noble gas, typically achieving polarizations from 10% to 20%.
C. Scanning protocol
The tubes’ phantom was placed on the MRI table, and advanced to the scan position. HP 3He was quickly introduced into the tubes from either end of the serpentine structure, either by applying suction using the glass syringe at one end and a Tedlar bag of HP 3He at the other end, or by injecting HP 3He with the glass syringe. Both approaches were used during the course of this study to ensure that the results were independent of the approach by which HP 3He was introduced.
A coronal static projection MR image of the tubes phantom was acquired immediately after completion of gas introduction. The scan employed a fast gradient echo pulse sequence, with the following parameters: FOV 46 cm, PhaseFOV 0.75, matrix 256 × 128, 13° −14° flip angle, minimum TE, 62.5 kHz bandwidth, and 1.00 NEX.
The phantom was imaged in the following positions:
flat on scanner table, approximately aligned with the magnet axis (rotated ~0°),
flat, rotated ~30°,
inclined ~arctan(½) or ~26.6°, rotated ~0°,
inclined ~arctan(½) or ~26.6°, rotated ~30°.
With the exception of the phantom placed flat on the scanner table and rotated ~30°, each of the other three positions was scanned at least twice, and diameter data processed from them thereafter.
During a separate session, the phantom was filled with about 85 ml of water containing approximately 2.5% Magnevist (Berlex Imaging, Wayne, NJ 07470) by volume. Upon advancing to the scan position, the phantom was scanned once in each of the above four orientations. The scan also employed a fast gradient echo pulse sequence, with FOV 46 cm, PhaseFOV 1.00, matrix 256 × 128, 30° flip angle, minimum TE, and 31.25 kHz bandwidth, and 4.00 NEX. Diameter values were also processed from these images.
D. Diameter measurement
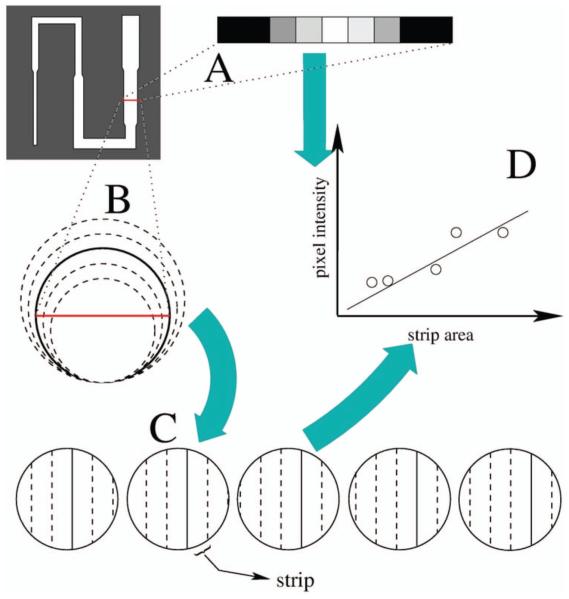
The tube diameters were quantified using three methods. First, the physical internal diameter of each tube was measured with a caliper. Second, one measurement of each tube was measured manually using the method developed by Lewis et al.30 Finally, for each tube, all pixel profiles not in the immediate vicinity of the tube connectors and belonging to a largely straight length of the tube were processed using the model-based algorithm. The model-based approach is based on the postulate that pixel intensities are integrals of the signal from the corresponding voxels. Illustrated in Fig. 2, this approach was implemented into a MATLAB algorithm to execute as follows.
Fig. 2.
Schematic of model-based algorithm for measuring tube diameters; (A) the selected tube section has a pixel intensity profile; (B) circles with diameters ranging from 70% to 130% of initial diameter guess are considered; (C) simulated pixel intensity profiles are calculated for each circle size; (D) a least-squares fit is performed between actual pixel intensity profiles and simulated pixel intensity profiles of different diameters; the diameter of the simulated pixel intensity profile with the minimum least-squares error when fit to the actual pixel intensity profile is the measured diameter of the selected tube section.
A row of pixels corresponding to a cross section of the tube was manually selected. An initial diameter estimate, d1, of the selected tube cross section was determined by manually picking two points where the pixel intensity faded into the dark background, corresponding to the edges of the cross section. Simulated, discrete intensity profiles were constructed for circular tube cross sections containing a uniform distribution of 3He gas according to
| (2) |
where db is the diameter of the uniform gas bolus occupying a circular tube cross section. Least-squares fits were carried out between the pixel intensity profile of the selected tube section, and the simulated pixel intensity profiles with db ranging from 0.70 × d1 to 1.30 × d1 in 0.05 × d1 increments. The db value that produced the minimum least-squares error from the first round of fitting was set as the intermediate diameter guess d2. A second round of least-squares error fitting was performed with db over the range d2±0.04 × d1 in increments of 0.01 × d1. The db value that produced the minimum least-squares error from the second round of fitting was considered as the measured diameter.
The least-squares error quantifying the difference between the actual pixel intensity profile and simulated pixel intensity profile was expressed as a fraction of the acquired data, given by
| (3) |
where A are the strip areas, I are the pixel intensities, and K, the constant of proportionality that achieves the least-squares fit between A and I. i denotes the indices of the pixels over which the least-squares error calculation was carried out.
IV. RESULTS
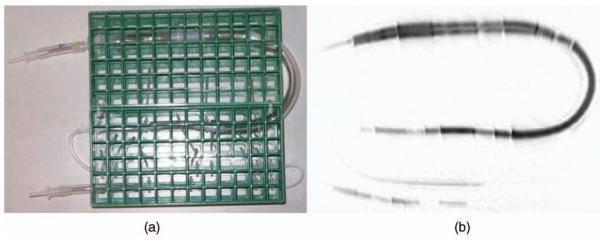
A digital image of the constructed tubes phantom is presented in Fig. 3(a), with a negative of its HP 3He MR image in Fig. 3(b).
Fig. 3.
The tubes phantom. (a) Digital photograph, (b) HP 3He MR projection negative.
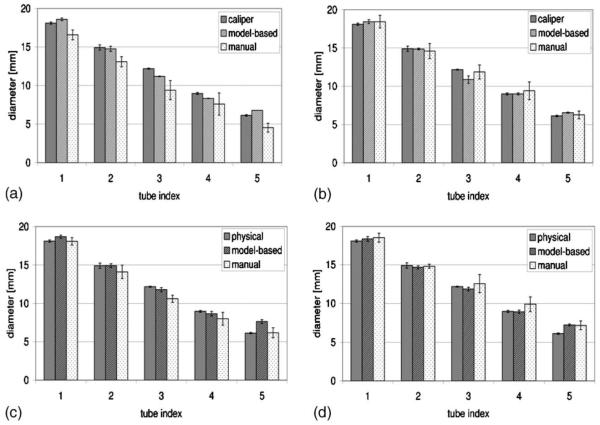
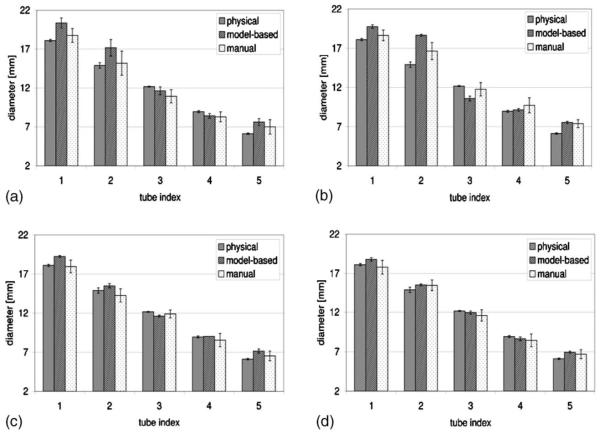
For each of the four phantom orientations, the tube diameters measured from the Magnevist-filled phantom are plotted in Figs. 4(a) through 4(d). For each tube, the measured diameter values were obtained from physically applying a caliper to the tube, execution of the best-fit algorithm on the pixel intensity profiles of the images, and manual identification of tube edges on the images, respectively. The means and standard deviations are plotted for the image-extracted diameters. The number of measurements that went into each set of plotted data is tabulated in Table I. Similarly, diameter measurements obtained from the HP 3He-filled phantom are plotted in Figs. 5(a) through 5(d), and the number of measurements is tabulated in Table II. Representative fits between actual and simulated pixel intensity profile for a section of tubes 3 and 4 are presented in Fig. 6 for proton MR images of the Magnevist-filled phantom, and HP 3He MR images of the 3He-filled phantom, both in the flat, unrotated position.
Fig. 4.
Comparison of algorithm- and manually measured image tube diameters from Magnevist-filled tubes phantom against physical values in various orientations. (a) Nominal orientation, (b) rotated orientation, (c) inclined orientation, (d) rotated/inclined orientation.
Table I.
Number of measurements carried out on MR images of Magnevist-filled tubes phantom to produce the plotted diameters numbers quoted are model-based/manual
| Tube index | 1 | 2 | 3 | 4 | 5 |
|---|---|---|---|---|---|
| Flat, aligned | 15/6 | 13/6 | 12/6 | 14/6 | 9/6 |
| Flat, rotated | 17/6 | 11/6 | 16/6 | 15/6 | 10/6 |
| Inclined, aligned | 10/6 | 12/6 | 12/6 | 16/6 | 10/6 |
| Inclined, rotated | 17/6 | 13/6 | 16/6 | 14/6 | 9/6 |
Fig. 5.
Comparison of algorithm- and manually measured image tube diameters from 3He-filled tubes phantom against physical values in various orientations. (a) Nominal orientation, (b) rotated orientation, (c) inclined orientation, (d) rotated/inclined orientation.
Table II.
Number of measurements carried out on HP 3He MR images to produce the plotted diameters numbers quoted are model-based/manual
| Tube index | 1 | 2 | 3 | 4 | 5 |
|---|---|---|---|---|---|
| Flat, aligned | 40/6 | 36/6 | 36/9 | 51/9 | 38/6 |
| Flat, rotated | 18/6 | 12/6 | 13/9 | 14/7 | 11/6 |
| Inclined, aligned | 10/6 | 8/6 | 7/7 | 11/7 | 9/6 |
| Inclined, rotated | 30/7 | 23/6 | 26/8 | 25/6 | 20/6 |
Fig. 6.
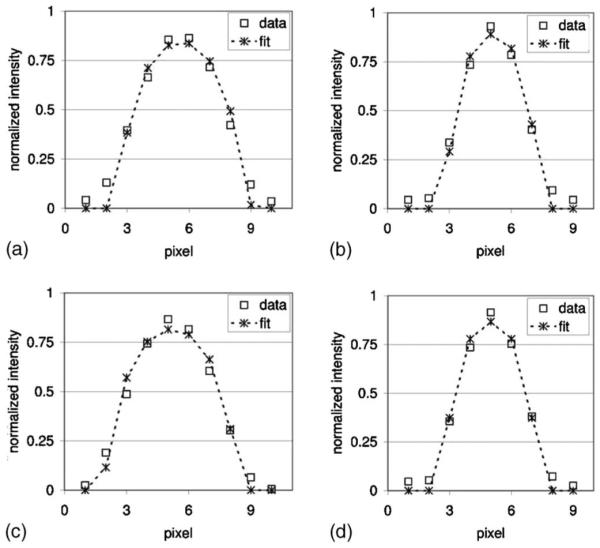
Imaged pixel intensity profiles and their corresponding model-based fits. (a) Tube 3, Magnevist-filled, (b) tube 4, Magnevist-filled, (c) tube 3, HP3He-filled, (d) tube 4, HP 3He-filled.
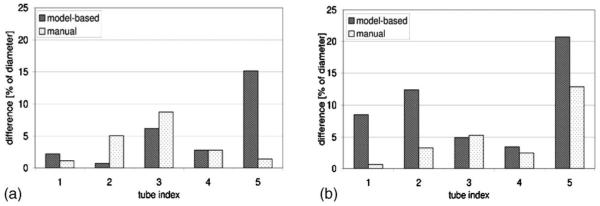
As shown in Fig. 7(a), for the Magnevist-filled phantom, the range of diameter values measured (mean ± standard deviation) using the model-based algorithm never exceeded the caliper-measured reference by more than one pixel dimension (1 × 1.8 mm). Compared to values yielded by the model-based algorithm, the range of diameter values measured manually from the images consistently had a higher maximum difference from caliper measurements, even exceeding it by 1× the pixel dimension for tube 3. The differences between means of the diameter measurements obtained from the images and those obtained with a caliper are then expressed as a percentage of the caliper-measured diameters in Fig. 8(a).
Fig. 7.
Maximum errors of the diameters measured from the images using various approaches; errors are expressed as multiples of the pixel dimension. (a) Magnevist-filled phantom, (b) HP 3He-filled phantom.
Fig. 8.
Mean errors of the diameters measured from the images using various approaches; errors are expressed as a percentage of caliper-measured diameters.
As for the HP 3He-filled phantom, Fig. 7(b) shows that the model-based diameter measurements for the two larger tube sizes (1 and 2) have greater differences from the caliper-measured values than their manually measured counterparts, exceeding it by more than 1× the pixel dimension. Model-based diameter measurements for the smaller tubes (3, 4, and 5) are comparable to those obtained with the Magnevist-filled phantom. The manually measured values typically stay within 1 pixel dimension from the reference, except for tube 2. The differences between means of the diameter measurements obtained from the images and those obtained with a caliper as a percentage of the caliper-measured diameters are depicted in Fig. 8(a).
V. DISCUSSION
A rigorous and physically based algorithm for measuring airway diameters from HP 3He MR images was developed in this work. Previous methods for measurement involved operator prescription of an image threshold, and identification of feature boundaries. In the new model-based method, human input is reduced to just the prescription of an initial diameter guess. Human judgment of diameter end-point locations is replaced by the impartial evaluation of least-squares fitting between the pixel intensity profile across tube sections and simulated pixel intensity profiles constructed from circles of various diameters. Instead of defining a preset threshold level for locating tube borders, the entire pixel intensity profile across a tube section is employed. As a result, all information available from the pixel intensity profile is utilized, and partial volume effects are fully accounted for. This, in turn, eliminates the constraint that diameter measurements be integer multiples of the pixel dimension, thereby enabling the technique to achieve subpixel resolution.
For each diameter the actual pixel intensity profile is being fitted to, numerous simulated pixel intensity profiles have to be computed (step C in Fig. 2). This is because for each MRI scan, it is not known a priori where the voxel boundaries of the scanned object are. The asymmetry of pixel intensity profiles in Fig. 6 confirms that the pixelation of the tube is not simply centered around its center.
A. Methodology validation using doped-water-filled phantom
In Figs. 4 and 7(a), the tubes phantom filled with Magnevist-doped water generally produced model-based diameter measurements superior to their manually obtained counterparts in accuracy. Even in the case of the smallest tube diameter when the manually measured diameter had a smaller mean error compared to caliper measurements, the model-based values still enjoyed a tighter standard deviation, indicating better consistency. This is an important validation of the model-based approach’s accuracy and consistency. Developing this technique with HP 3He MRI could raise concerns regarding how the nonequilibrium nature of the HP 3He signal might affect the pixel intensity profiles imaged. Establishing that the model-based algorithm works with proton MRI justifies the exploration into extending the same approach to HP 3He MRI.
Shown in Figs. 5 and 7(b), we are unable to explain the large differences between the mean diameters measured using a caliper and those measured with the model-based algorithm, particularly for tubes 1 and 2. These tube sizes are characteristic of the trachea and bronchus, which have not been the airways of interest when studying bronchoconstriction in asthma. The lesser error for tubes 3 through 5 are encouraging, suggesting that the technique remains promising for measuring airways in the subsequent airway generations.
Since the accuracy of the technique is limited by the resolution of the imaging modality, deviations from caliper-measured values of the tube diameters measured from the images were expressed in multiples of the pixel dimension in Figs. 7(a) and 7(b). The same deviation would result in increasingly higher percentage errors for decreasing tube diameters. This is well observed in Fig. 8(a) when comparable differences between algorithm- and caliper-measured diameters in tubes 3 and 5 resulted in much higher percentage errors for tube 5.
B. Consequences of adjusting imaging parameters
For HP 3He MRI of plastic tubes or lung airways, the pixel dimension of 1.8 mm results from a FOV of 46 cm and images consisting of 256 × 256 pixels. This corresponds to our typical acquisition parameters, and it does not represent any fundamental limit in the context of acquiring HP 3He MR images. We have considered increasing the diameter-to-pixel ratio to improve the accuracy of measuring diameters using our model-based algorithm. However, the typical MR imaging trade-offs also apply to our image acquisitions. We could increase the resolution by a factor of N, but that will come at the expense of increasing the scan time also by a factor of N, while reducing the SNR by a factor of N2. The SNR penalty is then increased when we take into account the fact that the 3He polarization lost during RF pulsing is not recoverable, and additional pulsing is needed to fill a larger matrix.
Alternatively, we could maintain both the scan time and matrix size, but reduce the FOV by a factor of N. This will require a factor of N increase in the gradients and result in a reduction of the SNR by a factor of N2. In HP 3He MRI, SNR estimation is complicated by the issue that the polarization of the 3He is continuously decaying toward its thermal equilibrium value, rather than returning to its initial hyperpolarized level. Thus, both SNR reduction estimates pertaining to steady-state proton MRI are a best case scenario for nonequilibrium HP noble gas MRI.
Increased scan times are highly undesirable for scanning human subjects. Using current scanning parameters, each image takes approximately 400 ms, allowing us to capture almost 20 dynamic projection images during the 10-s time period over which the subject is instructed to inhale a 1-liter bag of 3He mixture. A reduction in the temporal resolution of the image acquisition would accordingly reduce the number of images we acquire in that time, and increase the chances that we miss the moment when HP 3He optimally occupies the visible airways.
Previous airway imaging studies26 have documented that fourth-generation airways reach a maximum SNR of about 50. Using the two approaches previously mentioned for increasing image resolution with N=2, the resulting SNR of these airways will at least be reduced to 12.5. In studying asthmatic airways, it is believed that the primary airways affected are distal to the fourth-generation airways. SNR reduction as a result of pursuing higher image resolution is therefore even more undesirable.
C. Assessment of algorithm ability to measure tubes in various orientations
The intention of employing a variety of phantom orientations during imaging was to demonstrate and confirm the utility of the diameter measurement tool for measuring diameters of tubes in orientations other than just flat and aligned with the magnet axis. When applied to pulmonary imaging, airways may not be parallel with the plane of the scanner table nor aligned with the magnet axis. Using bilinear interpolation to determine the pixel intensities in the rotated image, the width and intensity profile across feature sections were found to be conserved. If an imaged tube were inclined relative to the image plane, segments across the resulting projection image’s features would correspond to oblique sections of the tube. Analytically, oblique sections of circular tubes are elliptical, equivalent to a circle uniformly stretched in one direction. This “stretching” would be reflected in the linear constant of proportionality between strip area and pixel intensity, and no changes to the diameter measurement procedure are necessary. Lengths obtained with the diameter measurement algorithm would be the minor axes of the oblique section ellipses, which are actually the diameters of the tubes. A schematic showing this phenomenon is shown in Fig. 9. The only exception to this would be if the airway of interest is inclined such that it is nearly perpendicular to the projection plane—a segment of pixels may correspond to an intersecting plane which crosses at least one end of the tube. This is in stark contrast to the measurement of airway cross-sectional length scales using CT, in which the algorithms were developed to interrogate those data by processing axial sections of airways. In an airway tree, as long as the measured section comes from a segment with slowly varying cross-sectional areas and is far from any airway bifurcations, moderate airway inclinations by themselves should not affect the fidelity of the measurement with this model-based approach.
Fig. 9.
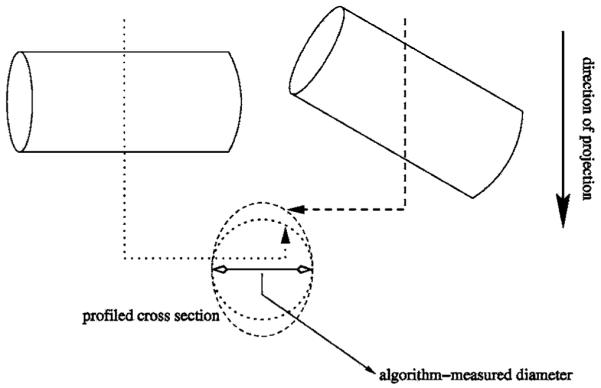
Projected tube sections with and without inclination; a projection through the tube that is perpendicular to the projection direction (dotted line) intersects a circular section (dotted circle); a projection through the tube tilted with respect to the projection direction (dashed line) intersects an elliptical section (dashed circle).
However, a major assumption in the development of the algorithm is that tube and airway sections are circular, with the diameter well represented by the projected profile. If the flow area were elliptical, then a measured length could correspond to anything from the major axis to the minor axis of the cross section. As the flow area further deviates from a perfect circle, the virtual circle model becomes increasingly poor in representing the flow path’s cross section. As a result, the algorithm-measured length would not correspond well to the distance across the feature on the projection. For the purpose of quantifying bronchoconstriction in asthma, any error resulting from a noncircular airway section may be unimportant if airway wall contraction were uniform around the perimeter of the section. A uniform contraction would preserve the shape of the airway section, and despite that the measured diameter for both the relaxed and constricted airways are in error, it is a bias error and therefore the fractional change in airway diameter is unaffected.
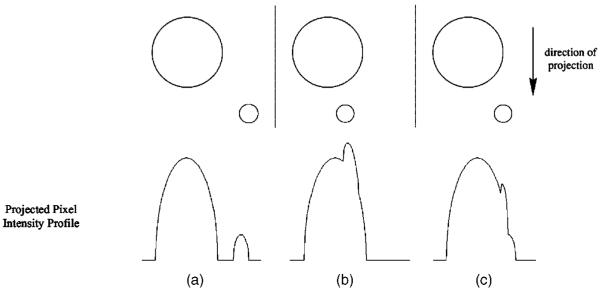
The application of this diameter measurement algorithm on actual airway projection images is prone to the signal perturbations caused by overlapping airways. A schematic of this issue is depicted in Fig. 10. For an actual airway tree, airways of various sizes and generations overlap with one another in a projection image. A full overlap such as that depicted in Fig. 10(b) could hide smaller airways in the signal of larger airways, and perturb parts of the larger airway’s pixel intensity profile to produce a poor fitting between the pixel intensity profile and strip areas from the virtual circles, resulting in an inaccurate diameter estimate. A partial overlap such as that depicted in Fig. 10(c) may result in extending the end points of an airway’s diameter. Because linearity between voxel gas volume and corresponding pixel intensity was confirmed in this study, a potential solution to the problem of overlapping airways may be to acquire coronal multislice images, and then construct a “projection” image by adding only the slices where the airway of interest is found. However, the success of this solution is highly contingent on the condition that no overlapping airways protrude into the slices containing the airway of interest.
Fig. 10.
Expected signal profiles from various configurations of airway projection overlap. (a) Magnevist-filled phantom, (b) HP 3He-filled phantom.(a) No overlap, (b) full overlap, (c) partial overlap.
To some degree, when imaging airway trees, the dynamic scanning protocol itself reduces the problem of overlapping airways for the larger of two overlapping airways. Dynamic projection images are acquired with a train of RF pulses as the HP 3He gas is inhaled. The polarization of the gas decreases exponentially with the number of RF pulses received. Thus, smaller airways have a disproportionately weaker signal, resulting from a combination of lower remaining gas polarization and smaller gas volume.
D. Additional considerations
If a large enough flip angle were selected for dynamic 3He MRI, gas polarization could be depleted within a few airway generations. However, if gas polarization survives until the distal airways and lung periphery, this signal level in the immediate vicinity of the airway being measured should be subtracted from the pixel intensity profile across the airway.
Implied in the algorithms developed in Data Analysis is the assumption that the point spread function (PSF) for this imaging modality is a simple impulse. This assumption could clearly be improved upon, as a gradual tapering off can clearly be observed toward the edges of the pixel intensity profiles for the two diameter sections in Fig. 6. Studies may be done in the future to examine which nonimpulse PSFs would be better candidates for employment in the diameter measurement algorithms. The match between the theoretical signal profile and pixel intensity data may benefit from such an upgrade, and result in improved diameter measurement accuracy.
The method developed here is similar to the model-based approach for blood vessel diameter measurements.32 However, several key differences exist. First, the MR images start out pixelated, whereas the angiograms were initially analog before being digitized. Second, the lower bound for the ratio between vessel diameter of interest and pixel resolution for the angiograms (0.4 mm: 0.037 mm, or 10.81:1), is essentially the upper bound for the same ratio for HP 3He MR images (20 mm: 1.8 mm, or 11.11:1). These two differences are fundamental in determining how the theoretical profiles for comparison to actual intensity profiles are created. With a high resolution, the digitized angiograms could afford to compare intensity profile data extracted from the image with continuous function values at discrete points along the section of a circle, paying little attention to how the profile of the circle changes over the distance of one pixel width. The lower resolution of the HP 3He MR images requires that strip areas actually be calculated to minimize errors arising from their poor representation when seeking an optimum least squares fit. Finally, angiograms are constructed from the attenuation of x rays as it goes through the body. In addition to the signal due to blood vessels, the resultant image also has significant contributions from the surrounding tissues. In HP 3He MRI, all the signal comes from the delivered gas bolus, and thus the only noise present should be random noise.
The diameter measurement technique developed in this study is a brute force approach, made feasible by the availability of computers capable of iteratively processing numbers in programmed fashions at high speeds. As a result, numerous combinations of tube diameter, cross-section slicing offset, and alignment between theoretical signal profile and actual pixel intensity profile, can be tested for optimal match up. The algorithm can be extended to any imaging modality and any anatomic feature as long as two conditions are met. First, the signal (or lack thereof) should scale with the volume of the feature being imaged. Second, the geometry of the imaged feature should be fully characterized by just one parameter, in much the same way as the geometry of a circle is fully defined once the diameter is known. Other potential applications include quantifying length scales of anatomic features visualized with nuclear imaging of radiopharmaceuticals or radionuclides, magnetic resonance angiography, and MRI with contrast agents.
VI. CONCLUSION
With the goal of measuring relaxed and asthma-constricted airway diameters in mind, a rigorous, Model-based algorithm with subpixel resolution has been developed for the measurement of tube diameters from projection HP 3He magnetic resonance images. The diameter whose circle could produce a simulated pixel intensity profile that yields the minimum least-squares error with a tube section’s pixel intensity profile is selected as the diameter of that tube section. The technique was applied on a phantom consisting of tubes of various sizes, and encouraging results in the measurement of the tubes’ diameters were obtained. Validation was first established by employing the technique on a phantom of plastic tubes filled with Magnevist solution. The approach was then extended to the same phantom of plastic tubes filled with HP 3He. The effects of tube orientation, cross-sectional geometry, and overlapping tubes, on the measured diameter and on the method’s effectiveness were discussed. Incorporation of a nonimpulse point spread function into the algorithm was considered as a future improvement to this algorithm. Potential applications of the technique to other imaging modalities were also suggested. Upon completion of this work, this tool will next be used to evaluate airway diameters imaged using HP 3He MRI, as well as quantify the occurrence of bronchoconstriction and bronchodilation in asthmatic subjects and non-asthmatic controls.
ACKNOWLEDGMENTS
We gratefully acknowledge support from the National Institutes of Health (EB001689), the National Aeronautics and Space Administration (NAG91469), and the National Science Foundation (BES-093448).
Contributor Information
Yang-Sheng Tzeng, Brigham and Women’s Hospital, Boston, Massachusetts 02115 and Department of Biomedical Engineering, Boston University, Boston, Massachusetts 02215.
Joey Mansour, Brigham and Women’s Hospital, Boston, Massachusetts 02115.
Zachary Handler, Brigham and Women’s Hospital, Boston, Massachusetts 02115.
Jessica Gereige, Brigham and Women’s Hospital, Boston, Massachusetts 02115.
Niral Shah, Brigham and Women’s Hospital, Boston, Massachusetts 02115 and Department of Biomedical Engineering, Boston University, Boston, Massachusetts 02215.
Xin Zhou, Brigham and Women’s Hospital, Boston, Massachusetts 02115.
Mitchell Albert, Brigham and Women’s Hospital, Boston, Massachusetts 02115.
References
- 1.American Lung Association . Trends in asthma morbidity and mortality. 2005. Epidemiology & Statistics Unit, Research and Program Services. [Google Scholar]
- 2.Henderson AC, Ingenito EP, Atileh H, Israel E, Suki B, Lutchen KR. How does airway inflammation modulate asthmatic airway constriction? An antigen challenge study. J. Appl. Physiol. 2003;95:873–882. doi: 10.1152/japplphysiol.00075.2003. [DOI] [PubMed] [Google Scholar]
- 3.Lutchen KR, Gillis HL. Relationship between heterogeneous changes in airway morphometry and lung resistance and elastance. J. Appl. Physiol. 1997;83:1192–1201. doi: 10.1152/jappl.1997.83.4.1192. [DOI] [PubMed] [Google Scholar]
- 4.Weibel ER. Morphometry of the Human Lung. Academic; New York: 1963. pp. 136–143. [Google Scholar]
- 5.Horsfield K, Dart G, Olson DE, Filley GF, Cumming G. Models of the human bronchial tree. J. Appl. Physiol. 1971;31(2):207–217. doi: 10.1152/jappl.1971.31.2.207. [DOI] [PubMed] [Google Scholar]
- 6.Horsfield K, Cumming G. Morphology of the bronchial tree in man. J. Appl. Physiol. 1968;24(3):373–383. doi: 10.1152/jappl.1968.24.3.373. [DOI] [PubMed] [Google Scholar]
- 7.Mitchell HW, Gray PR. Uncoupling in the wall of the cartilaginous bronchus of the pig produced by smooth muscle contraction. Pulm Pharmacol. 1996;9:29–34. doi: 10.1006/pulp.1996.0003. [DOI] [PubMed] [Google Scholar]
- 8.Saba OI, Delsing A, Tschirren J, Sieren J, Nixon E, McLennan G, Hoffman EA. Normative airway geometry and topology measured by multidetector-row CT (MDCT) at two lung volumes; presented at the American Thoracic Society 2005 Conference; San Diego, CA. 2005; unpublished. [Google Scholar]
- 9.King GG, Müller NL, Paré PD. Evaluation of airways in obstructive pulmonary disease using high-resolution computed tomography. Am. J. Respir. Crit. Care Med. 1999;159:992–1004. doi: 10.1164/ajrccm.159.3.9805064. [DOI] [PubMed] [Google Scholar]
- 10.Brown RH, Croisille P, Mudge B, Diemer FB, Permutt S, Togias A. Airway narrowing in healthy humans inhaling methacholine without deep inspirations demonstrated by HRCT. Am. J. Respir. Crit. Care Med. 2000;161:1256–1263. doi: 10.1164/ajrccm.161.4.9806051. [DOI] [PubMed] [Google Scholar]
- 11.Brown RH, Scichilone N, Mudge B, Diemer FB, Permutt S, Togias A. High-resolution computed tomographic evaluation of airway distensibility and the effects of lung inflation on airway caliber in healthy subjects and individuals with asthma. Am. J. Respir. Crit. Care Med. 2001;163:994–1001. doi: 10.1164/ajrccm.163.4.2007119. [DOI] [PubMed] [Google Scholar]
- 12.Brown RH, Zerhouni EA, Mitzner W. Visualization of airway obstruction in vivo during pulmonary vascular engorgement and edema. J. Appl. Physiol. 1995;78(3):1070–1078. doi: 10.1152/jappl.1995.78.3.1070. [DOI] [PubMed] [Google Scholar]
- 13.Gono H, Fujimoto K, Kawakami S, Kubo D. Evaluation of airway wall thickness and air trapping by HRCT in asymptomatic asthma. Eur. Respir. J. 2003;22:965–971. doi: 10.1183/09031936.03.00085302. [DOI] [PubMed] [Google Scholar]
- 14.Little SA, et al. High resolution computed tomographic assessment of airway wall thickness in chronic asthma: Reproducibility and relationship with lung function and severity. Thorax. 2002;57:247–253. doi: 10.1136/thorax.57.3.247. [DOI] [PMC free article] [PubMed] [Google Scholar]
- 15.Niimi A, et al. Airway wall thickness in asthma assessed by computed tomography—Relation to clinical indices. Am. J. Respir. Crit. Care Med. 2000;162:1518–1523. doi: 10.1164/ajrccm.162.4.9909044. [DOI] [PubMed] [Google Scholar]
- 16.Nakano Y, et al. Quantitative assessment of airway remodeling using high-resolution CT. Chest. 2002;122:271S–275S. [PubMed] [Google Scholar]
- 17.McNamara AE, Müller NL, Okazawa ML, Arntorp J, Wiggs BR, Paré PD. Airway narrowing in excised canine lungs measured by high-resolution computed tomography. J. Appl. Physiol. 1992;73(1):307–316. doi: 10.1152/jappl.1992.73.1.307. [DOI] [PubMed] [Google Scholar]
- 18.King GG, Müller NL, Whitall KP, Xiang Q-S, Paré PD. An analysis algorithm for measuring airway lumen and wall areas from highresolution computed tomographic data. Am. J. Respir. Crit. Care Med. 2000;161:574–580. doi: 10.1164/ajrccm.161.2.9812073. [DOI] [PubMed] [Google Scholar]
- 19.Amirav I, Kramer SS, Grunstein MM, Hoffman EA. Assessment of methacholine-induced airway constriction by ultrafast highresolution computed tomography. J. Appl. Physiol. 1993;75(5):2239–2250. doi: 10.1152/jappl.1993.75.5.2239. [DOI] [PubMed] [Google Scholar]
- 20.Möller HE, et al. MRI of the lungs using hyperpolarized noble gases. Magn. Reson. Med. 2002;47:1029–1051. doi: 10.1002/mrm.10173. [DOI] [PubMed] [Google Scholar]
- 21.Viallon M, et al. Functional MR microscopy of the lung using hyperpolarized 3He. Magn. Reson. Med. 1999;41:787–792. doi: 10.1002/(sici)1522-2594(199904)41:4<787::aid-mrm18>3.0.co;2-4. [DOI] [PubMed] [Google Scholar]
- 22.Möller HE, et al. Sensitivity and resolution in 3D NMR microscopy of the lung with hyperpolarized noble gases. Magn. Reson. Med. 1999;41:800–808. doi: 10.1002/(sici)1522-2594(199904)41:4<800::aid-mrm20>3.0.co;2-k. [DOI] [PubMed] [Google Scholar]
- 23.Chen BT, Brau ACS, Johnson GA. Measurement of regional lung function in rats using hyperpolarized 3Helium dynamic MRI. Magn. Reson. Med. 2003;49:78–88. doi: 10.1002/mrm.10336. [DOI] [PubMed] [Google Scholar]
- 24.Wild JM, et al. Dynamic radial projection MRI of inhaled hyperpolarized 3He gas. Magn. Reson. Med. 2001;49:991–997. doi: 10.1002/mrm.10477. [DOI] [PubMed] [Google Scholar]
- 25.Chen XJ, et al. MR microscopy of lung airways with hyperpolarized 3He. Magn. Reson. Med. 1998;39:79–84. doi: 10.1002/mrm.1910390113. [DOI] [PubMed] [Google Scholar]
- 26.Tooker AC, Hong KS, McKinstry EL, Costello P, Jolesz FA, Albert MS. Distal airways in humans: Dynamic hyperpolarized 3He MR imaging—Feasibility. Radiology. 2003;227:575–579. doi: 10.1148/radiol.2272012146. [DOI] [PubMed] [Google Scholar]
- 27.Dupuich D, Berthezene Y, Clouet P-L, Stupar V, Canet E, Cremillieux Y. Dynamic 3He imaging for quantification of regional lung ventilation parameters. Magn. Reson. Med. 2003;50:777–783. doi: 10.1002/mrm.10590. [DOI] [PubMed] [Google Scholar]
- 28.Altes TA, et al. Hyperpolarized 3He MR lung ventilation imaging in asthmatics: Preliminary findings. J. Magn. Reson Imaging. 2001;13:378–384. doi: 10.1002/jmri.1054. [DOI] [PubMed] [Google Scholar]
- 29.Samee S, et al. Imaging the lungs in asthmatic patients by using hyperpolarized Helium-3 magnetic resonance: Assessment of response to methacholine and exercise challenge. J. Allergy Clin. Immunol. 2003;111(6):1205–1211. doi: 10.1067/mai.2003.1544. [DOI] [PubMed] [Google Scholar]
- 30.Lewis TA, et al. Quantification of airway diameters and 3D airway tree rendering from dynamic hyperpolarized 3He magnetic resonance imaging. Magn. Reson. Med. 2005;53:474–478. doi: 10.1002/mrm.20349. [DOI] [PMC free article] [PubMed] [Google Scholar]
- 31.Weibel ER, Gomez DM. Architecture of the human lung. Science. 1962;137:577–585. doi: 10.1126/science.137.3530.577. [DOI] [PubMed] [Google Scholar]
- 32.Chan RC, Karl WC, Lees RS. A new model-based technique for enhanced small-vessel measurements in x-ray ciné-angiograms. IEEE Trans. Med. Imaging. 2000;19(3):243–255. doi: 10.1109/42.845182. [DOI] [PubMed] [Google Scholar]
- 33.Henkelman RM. Measurement of signal intensities in the presence of noise in MR images. Med. Phys. 1985;12(2):232–233. doi: 10.1118/1.595711. [DOI] [PubMed] [Google Scholar]
- 34.Henkelman RM. Erratum: Measurement of signal intensities in the presence of noise in MR images. Med. Phys. 1986;13(4):544. doi: 10.1118/1.595711. [DOI] [PubMed] [Google Scholar]
- 35.Bushberg JT, Seibert JA, Leidholdt EM, Boone JM. The Essential Physics of Medical Imaging. 2nd ed. Lippincott Williams & Wilkins; Philadelphia, PA: 2002. [Google Scholar]


