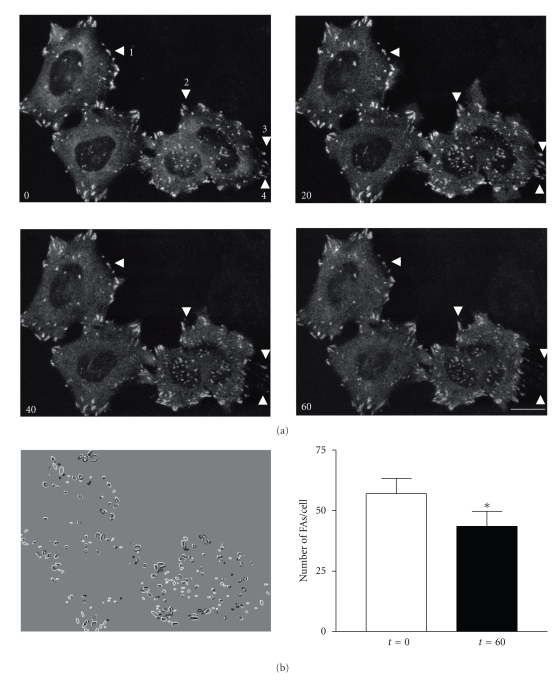
Figure 3.
Analysis of FA behavior upon FAK hyperphosphorylation. (a) Confocal time-lapse images of FAK/Ycam expressed cells were collected every 5 minutes for 1 hour after PV addition. Confocal images of living cells at 0, 20, 40, and 60 minutes are shown. Arrowheads, labeled 1 to 4, indicate areas of FA disassembly. Scale bar, 10 μm. (b) Image J software was used to apply a filter and a size constraint to FAs and the image shown results from the merging of images at t = 60 (black) and t = 0 (white). Newly formed FA (black) and dissociated FA (white). Graph represents the number of FA/cell that was measured by the segmentation/size criteria process both before PV (t = 0, white bar) and after 60 minutes PV treatment (t = 60, black bar) from 8 cells (mean ± s.e.m.). Note the significant decrease in the number of FAs in cells treated with PV compared to untreated cells (P < .05).

