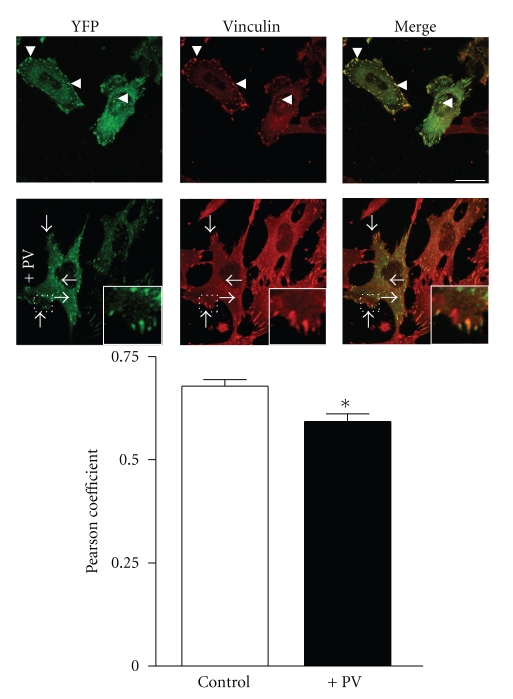
Figure 4.
Colocalization of FAK and vinculin. After PV treatment, cells were fixed and immunolabeled for vinculin (Rhodamine Red-X). Arrowheads point to FAs in untreated cells and arrows point to FAs in cells treated for 20 minutes with PV. Inserts are magnified images of indicated boxed regions. Note the reduction in the degree of colocalization of FAK (green) with vinculin (red) at FAs (arrows). Quantification of colocalization was determined by Pearson's coefficient using Image J software and the graph represents means ± s.e.m. of more than 20 FAs analyzed per condition.

