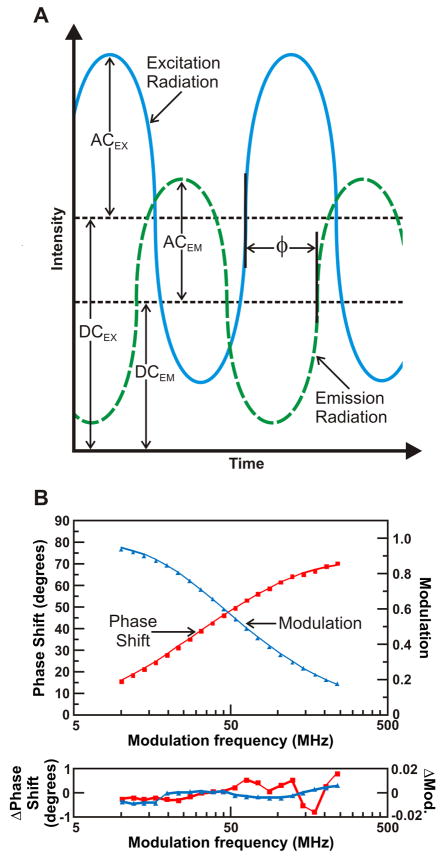
Figure 4.
(A) Relationship between excitation and emission radiation in frequency-domain fluorescence spectroscopy demonstrating the origin of experimentally observed quantities. The AC represents the amplitude of the alternating current wave and the DC represents the direct current magnitude for the excitation (solid) and emission (dashed), respectively. The ratio of the AC components of the perpendicular and parallel emission is termed modulation ratio. φ defines the phase shift, while Δφ corresponds to the difference in phase between the perpendicular and parallel emission components. The frequency of the excitation light is constant, while the light intensity modulation frequency is varied in a frequency-domain anisotropy decay measurement. (B) FD fluorescence lifetime raw data, multicomponent fits, and curve fitting residuals for ribosome-bound full-length apoHmpH a prokaryotic globin protein [98]. Following resuspension, ATP (0.5 μM), KCl (100 mM), and the GrpE (0.4 μM) and DnaJ (0.4 μM) chaperones were added to the apoHmpH RNCs.

