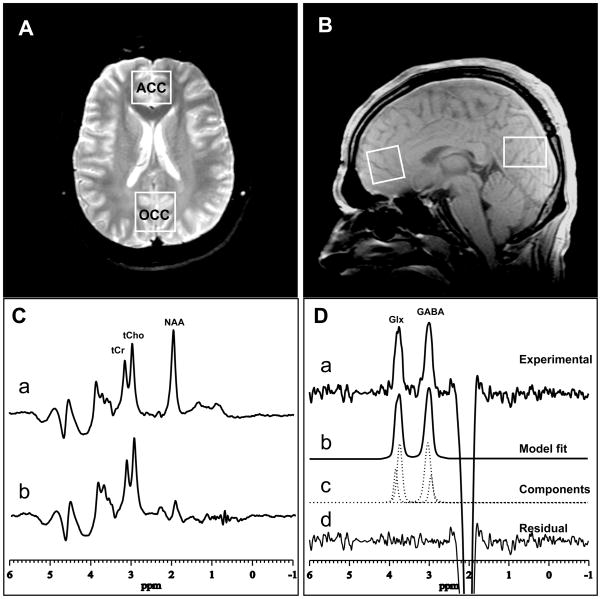
FIGURE 1.
(A) axial and (B) sagittal images showing ACC and OCC voxel sizes and locations; (C) PRESS 1H MR spectra with “editing” rf pulse (a) off and (b) on. (D) The difference of the spectra in (C) showing: (a) the detected GABA and Glx peaks, with (b–d) best-fit model curves and residuals, which yield the areas under the peaks. The depicted data were acquired in 13 min from a 2.5×2.5×3.0 cm3 ACC voxel, using TE/TR 68/1500 ms, and 256 interleaved excitations (total 512) with editing pulse on or off.

