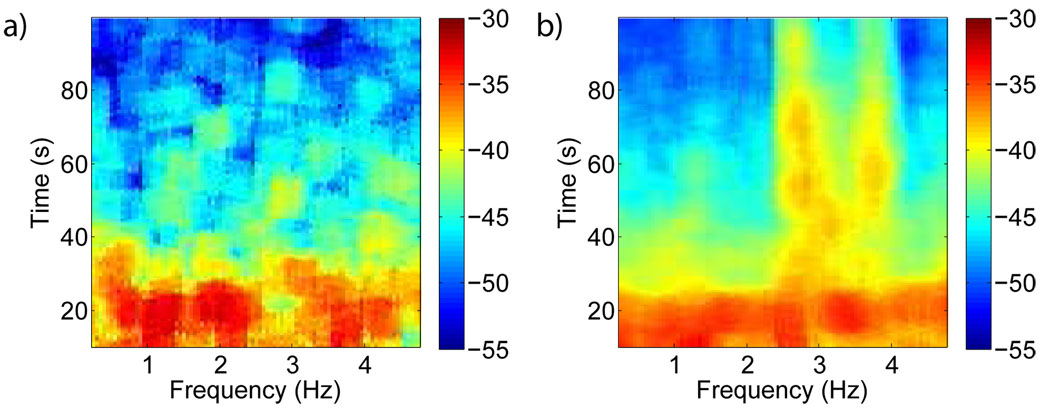
Figure 6. Spectrogram.
Data from macaque monkey performing a working memory task: (a) Basline spectrogram of the LFP and (b) Spectrogram of the LFP during the memory period, which begins when the target is made visible at 2.5s, is plotted on a logarithmic scale. Sharp enhancement in high frequency power occurs during the working memory period.

