Figure 4.
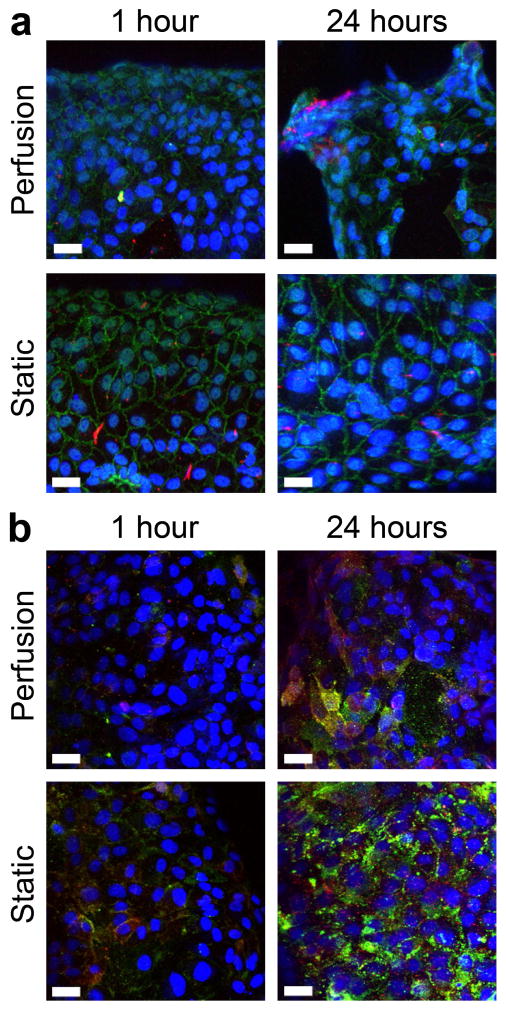
Phenotype of HUVEC on modules within the remodeling chamber. (a) VE-cadherin (green) and KLF2 (red) expression. In many cases, KLF2 expression appeared to increase with flow. VE-cadherin in static controls appeared continuous around the perimeter of cells; however, with perfusion, expression around the cell perimeter was discontinuous and, at 24 hours, was seen throughout the cell. (b) HUVEC activation was determined by ICAM-1 (red) and VCAM-1 (green) staining. Several flow cases showed lower ICAM-1 and VCAM-1 expression, but these results were not statistically significant. Scale bars are 10 μm.

