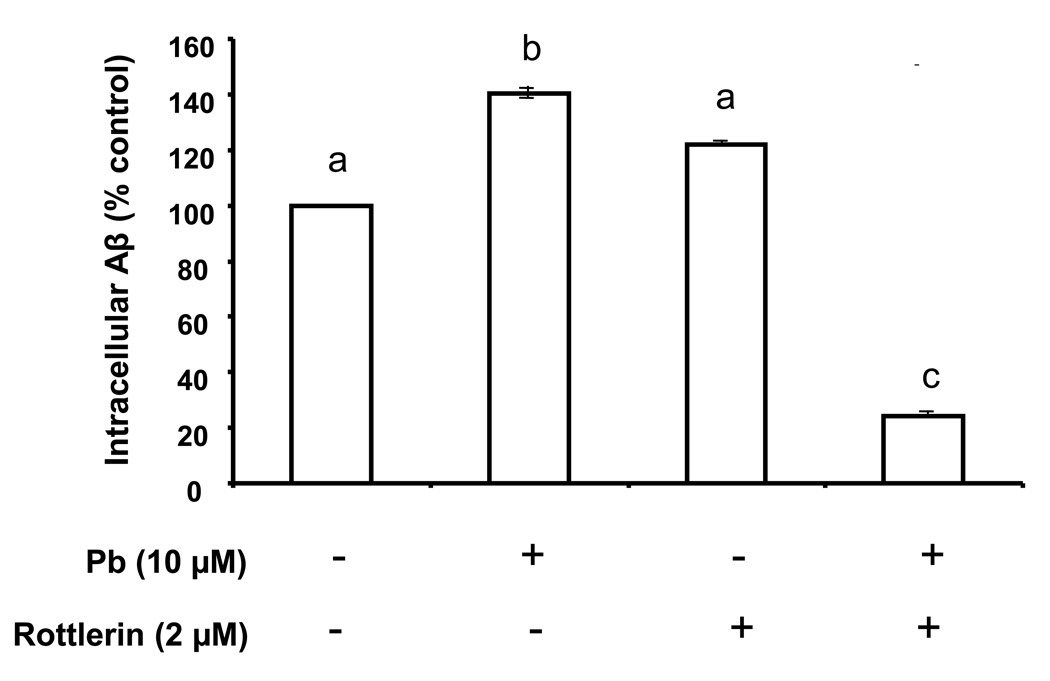
Fig. 6.
Quantification of the fluorescent signals using Laser Scanning Cytometry. The fluorescent signals in Fig. 5 were quantified using software Image J. The bar designated Pb(−)/rottlerin (−) represents untreated controls, Pb(+)/rottlerin(−) represents treatment with Pb in absence of rottlerin, Pb(−)/rottlerin (+) represents incubation with rottlerin in absence of Pb, and Pb (+)/rottlerin(+) represents tissues pre-treated with rottlerin followed by Pb. Data represent mean ± SD, n=16 (a total of 16 cells per group taken from 4 tissue samples with fluorescence averaged from 4 cells per sample). Bars with different superscripts labeled as a,b,c indicate significant difference from one another.

