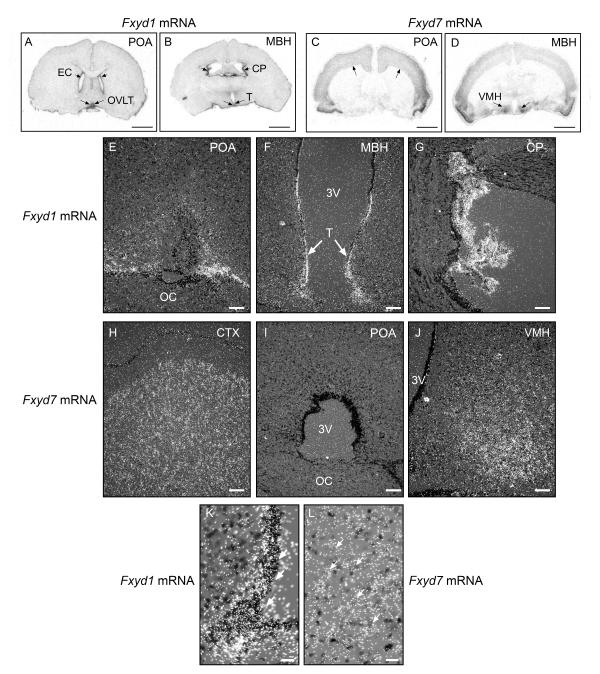
Figure 3.
Regional differences in Fxyd1 and Fxyd7 mRNA expression in the brain of prepubertal 28-day-old female rats as assessed by in situ hybridisation using 35S-UTP labelled cRNA probes. A, Low magnification view of a coronal section of the rat brain at the level of the POA showing the distribution of Fxyd1 mRNA transcripts. B, Similar view at the level of the MBH. C, Low magnification view of a coronal section of the rat brain at the level of the POA showing the distribution of Fxyd7 mRNA transcripts. D, Similar view at the level of the MBH. Bars in A-D = 250 μm. E, Higher magnification view of the POA region showing the cellular sites of Fxyd1 mRNA expression. F, The MBH, and G, The choroid plexus. H, Higher magnification view of the cerebral cortex showing the cellular sites of Fxyd7 mRNA expression.. I, the POA, and J, The MBH. Bars in E-J = 100 μm. K, High magnification image of the ventrolateral aspect of the third ventricle showing that tanycytes express an abundance of Fxyd1 mRNA transcripts (examples denoted by white arrows). L, High magnification view of the VMH showing the presence of Fxyd7 transcripts in cells with large, pale nuclei that, because of these characteristics, appear to be neurones (examples denoted by arrows). EC = ependymal cells; OVLT = organum vasculosum of the lamina terminalis; CP = choroid plexus; T = tanycytes; OC = optic chiasma; VMH = ventromedial nucleus; 3V = third ventricle.

