Figure 2.
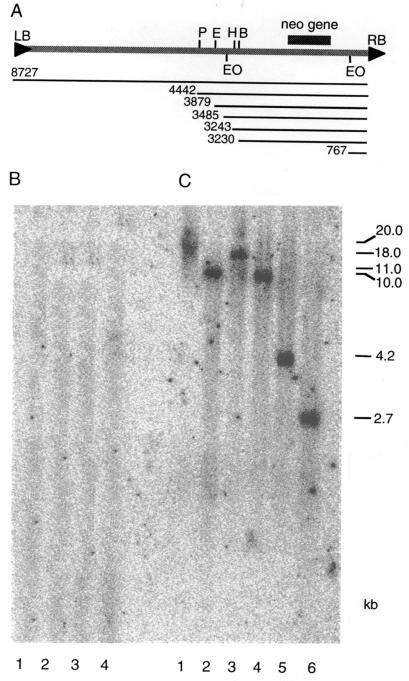
Southern blot analysis of a geneticin-resistant HeLa cell line stably transformed by Agrobacterium. (A) Organization of the pNeo plasmid. The T-DNA region of pNeo with the restriction sites used for the Southern blot analysis is shown. P, H, E, B, and EO indicate PstI, BamHI, EcoRI, HindIII, or Eco0109I restriction enzyme sites, respectively. LB and RB indicate left and right T-DNA borders, respectively. Thin lines indicate the length of the entire T-DNA and distances of each restriction site from RB in base pairs. The location of the neomycin resistance (neo) gene is shown. The pNeo backbone (6 kb, not shown) outside of the T-DNA region is that of the parental pPZP221 vector (ref. 15; GenBank accession no. U10490). (B) Wild-type untransformed cell line. (C) Stably transformed cell line. Lanes 1 to 6 show digestions with SalI, PstI, BamHI, EcoRI, HindIII, or Eco0109I restriction enzymes, respectively. The blots were hybridized with a 740-bp radiolabeled probe corresponding to the neomycin resistance gene of pNeo (see A). The sizes of the restriction-fragment bands were calculated based on standards and are indicated on right in kilobase pairs (kb).

