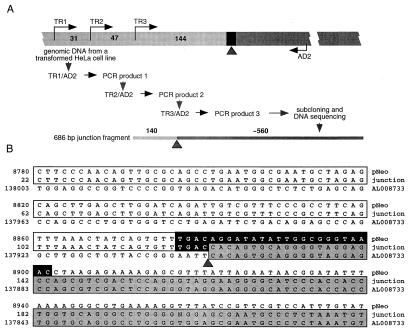
Figure 3.
Cloning of the T-DNA–HeLa DNA integration junction. (A) TAIL-PCR cloning strategy. Wide bar illustrates the genomic DNA from a transformed HeLa cell line used as a template, black rectangle indicates the region of the right T-DNA border, and numbers indicate distances between the nested sense PCR primers TR1 and TR2, TR2 and TR3, and TR3 and the right border. AD2 is the degenerate antisense primer expected to anneal within HeLa-cell DNA. Narrow bar indicates the amplified junction fragment in outline, and numbers indicate the size of its corresponding T-DNA and HeLa-DNA components. Light and dark segments of both bars indicate T-DNA and HeLa-cell DNA, respectively, whereas the arrowhead indicates the integration point between these sequences. For primer sequences and description of PCRs, see Materials and Methods. (B) Nucleotide sequence alignment of the right T-DNA-border region of pNeo, the isolated integration junction from an Agrobacterium-transformed HeLa-cell DNA, and the human genomic DNA (GenBank accession no. AL008733). All sequences are shown in the 5′ to 3′ direction. The pNeo sequence is based on the right border region of the parental pPZP221 vector (15) (GenBank accession no. U10490) and the human DNA sequence is from clone RP1–163G9 from chromosome 1p36.2–36.3. The consensus nopaline-type right T-DNA-border sequence, described in refs. 33 and 57, is indicated by a black box. Homology of the junction fragment to pNeo is indicated by open boxes and to the human DNA by shaded boxes. Arrowhead indicates the integration point at which the right T-DNA border is fused to the human DNA. Note also that the DNA sequences upstream of the position 22 and downstream of the position 221 in the 686-bp junction fragment were identical to the corresponding regions of the pNeo and AL008733 DNA, respectively (data not shown).

