
Figure 2. Growth of liver and lung metastases in Tsp1-null and wild-type mice.
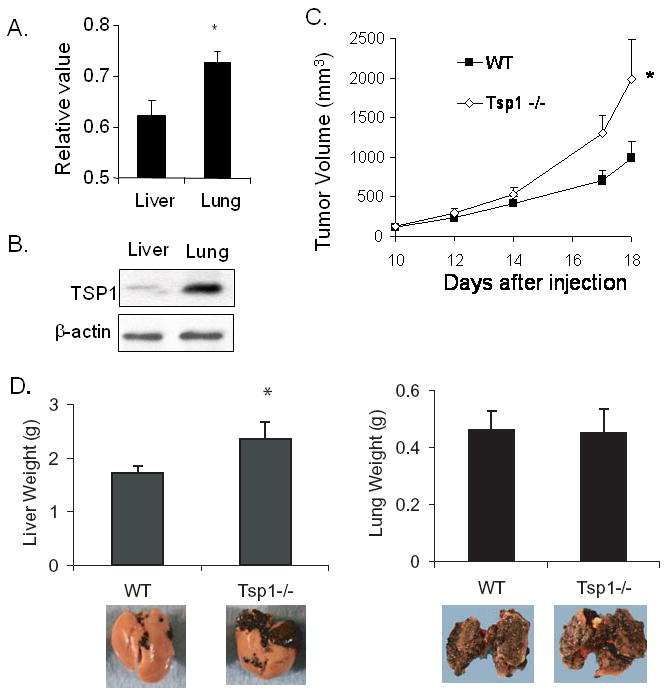
(A) Relative levels of Tsp1 expression in normal mouse liver and lung as measured by quantitative RT-PCR. (B) Western blot analysis of TSP1 in normal mouse liver and lung. β-actin blot serves as loading control. (C) Flank tumor growth of B16F10 cells in Tsp1-null mice (Tsp1-/-) and wild-type littermates (WT). (D)) Mean weight of livers and lung harvested from mice 14 days after intra-portal injection or 21 days after tail vein injection of B16F10 cells. Bars represent standard deviation. *p<0.05.