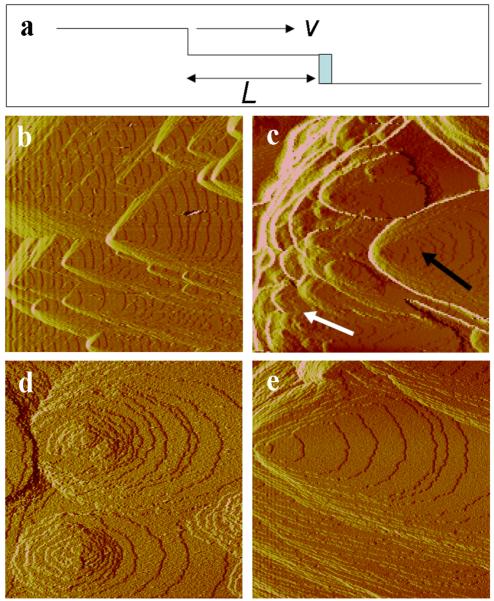
Fig. 1.
(a) Diagram illustrating addition of solute to step and relationship between terrace exposure time, step speed and terrace width. (b-e) AFM images of growth hillocks on COM face during growth in (b) peptide-free solution and (c-e) following exposure to 10nM D3S solution. White and black arrows in (c) indicate small (d) and large (e) hillocks, respectively. Horizontal dimensions: (b) 13 μm; (c) 12 μm; (d,e) 5 μm.

