Fig. 2.
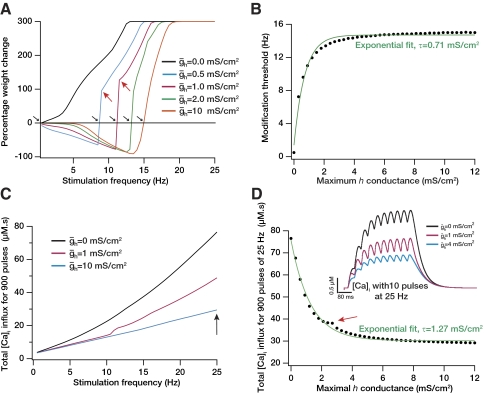
Increase in the h current produced a saturating rightward shift to the Bienenstock-Cooper-Munro (BCM)-like synaptic plasticity profile through reduction in intracellular calcium influx. A: percentage weight change induced by 900 stimulus pulses at various frequencies plotted as a function of the stimulus frequency for different values of maximal h-channel conductance, ḡh. A progressive rightward shift in the curve may be noted with increases in ḡh. winit = 0.25 for these simulations (see Supplementary Fig. S2). B: quantifying the modification threshold, θm (indicated by black arrows in A), as a function of ḡh shows a saturating rightward shift in the BCM-like plasticity profile with increase in ḡh. winit = 0.25 for these simulations (see Supplementary Fig. S2). C: total calcium influx (area under the curve) obtained after 900 pulses of synaptic stimulation at a given frequency plotted as a function of the frequency of stimulation. The plots for various values of ḡh indicate the reduction of calcium influx with increase in ḡh. D: total calcium influx at the end of 900 pulses of 25 Hz synaptic stimulation plotted as a function of ḡh. Inset: an illustration with typical traces of intracellular calcium obtained with 10 pulses of 25 Hz synaptic stimulation with 3 different values of ḡh. It may be noted that a higher value of ḡh leads to a reduction in intracellular calcium levels. All red arrows indicate the point at which compartment switched from generating a spike to generating a subthreshold EPSP.

