Fig. 3.
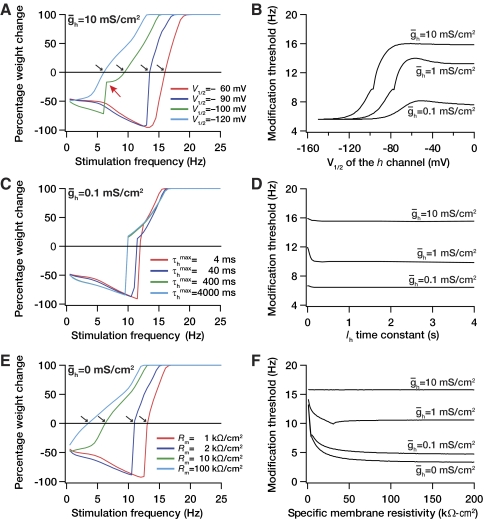
Dependence of modification threshold on parameters associated with the model. Percentage weight change induced by 900 stimulus pulses at various frequencies plotted as a function of the stimulus frequency for different values of the half-maximal activation voltage V1/2 of the h conductance (A), h channel (de)activation time constant (C), and specific membrane resistivity (E). The values of maximal h-channel conductance ḡh for each of these cases are provided on the top of the individual panels. The modification threshold as a function of the half-maximal activation voltage V1/2 of the h conductance (B), h channel (de)activation time constant (D), and specific membrane resistivity (F), each plotted for various values of maximal h-channel conductance ḡh.

