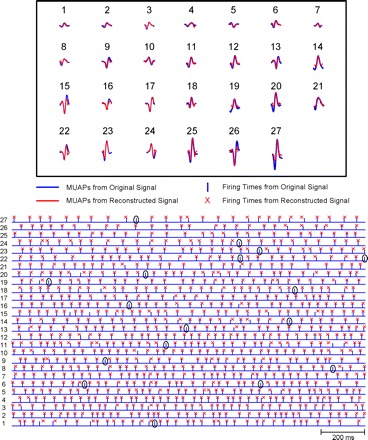
Fig. 10.

Comparison of the decomposition of the original sEMG signal and that of the synthesized signal. Top: the action potential shapes of the 28 motor unit action potential (MUAPs) that were identified in both the original sEMG signal and the synthesized signal. Note the similarity in the shapes of each individual motor unit recognized in both decompositions. Bottom: a short epoch of the firings of the 28 motor unit action potential trains (MUAPTs). The bar represents the firing instances from the decomposition of the original sEMG signal; the X indicates those from the decomposition of the synthesized signal. Note that in those firings where the two instances are not superimposed, the location of the X remains in the same motor unit. In other words, there may be some misalignment resulting from 1 of the 2 decompositions (unpaired events), but identification errors were rare. Seventeen are identified in the figure.
