
Fig. 5.
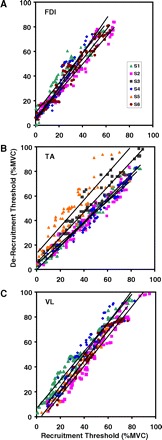
Relationship between recruitment threshold and de-recruitment threshold is shown. The data from the VL, FDI, and TA are shown. The data from all force levels were grouped together. The lines represent the regression analysis for the data from each subject. Note that the relationship varies slightly in slope for all the subjects in each muscle. In the FDI muscle, all the data points lie above the unity line, indicating that the de-recruitment threshold is always greater than the recruitment threshold. In the VL, a few motor units from 2 subjects lie below the unity line in the range below 50% MVC. In the TA, the shift from the unity line is less well organized.