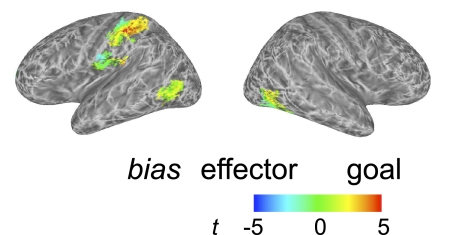
Fig. 8.
Regions in which representations are biased for effector or goal (experiment 2). These data were first masked to select regions for which accuracy in the overall crossmodal analysis (Fig. 7) was above chance. Vertices are colored to indicate a bias in favor of either discrimination of the action effector (blue/cyan) or discrimination of the action goal (red/yellow). Areas with no bias are shown in green. Note a gradient in the bias from effector (postcentral gyrus) to action (superior parietal cortex).

