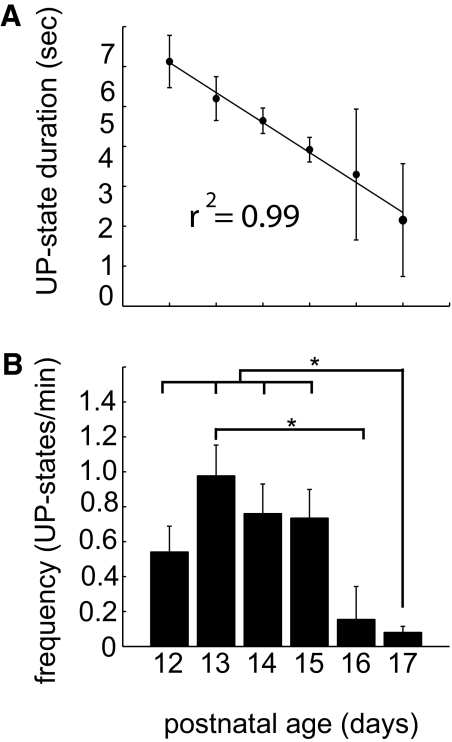
Fig. 2.
up-state frequencies and duration by age. A: mean up-state duration decreased linearly with age from P12 to P17. Error bars represent ±SE. B: up-state frequencies in up-states per minute. Significant differences indicated with asterisks (P < 0.05). Number of cells analyzed: P12, 3; P13, 11; P14, 8; P15, 11; P16, 3; P17, 6.

