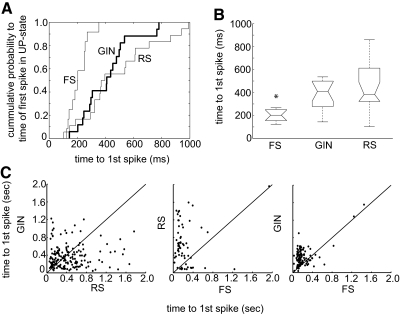
Fig. 4.
Time to 1st spike during a given up-state differs according to cell type. A: cumulative distribution plots of times in milliseconds to the 1st spike in an up-state averaged for each cell. B: median times to 1st spike for each cell type. FS median is significantly different from RS and GIN (P < 0.001). Conventions for box-and-whisker plots as in Fig. 3. C: times to 1st spike in up-states for the neuronal pair types indicated (RS-GIN, n = 14 pairs, 166 up-states; RS-FS, n = 3 pairs, 62 up-states; FS-GIN, n = 5 pairs, 111 up-states). Note that times to 1st spike that were >2 s were not included in graphs in C. Solid lines indicate unity.

