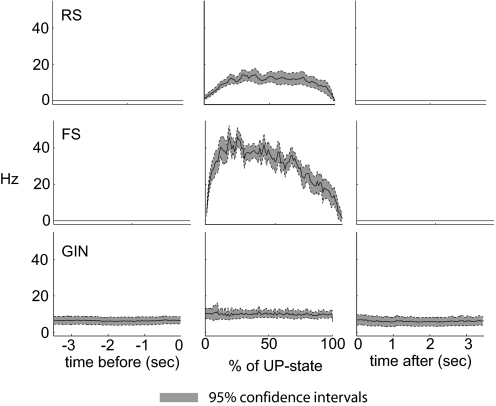
Fig. 5.
Distribution of firing before, during, and after up-states. Firing rates are shown for the 5 s before and after up-states (left and right, respectively) and for up-states themselves (middle). up-states were normalized in time by up-state durations, i.e., spike times were calculated as a percent of the total up-state duration. Solid lines indicate means and dotted lines/shading indicate 95% CIs. Number of cells analyzed: RS, 20; FS, 12; GIN, 21.

