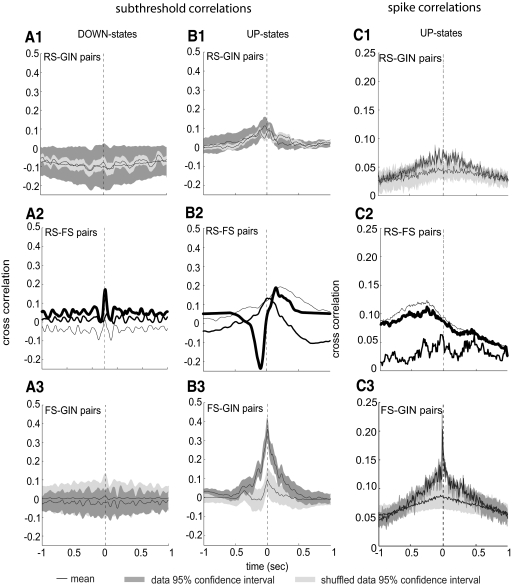
Fig. 6.
Sub- and suprathreshold cross-correlations for each type of cell pair. A1–A3: subthreshold cross-correlations for RS-GIN (number of pairs = 14; number of up-states = 239), RS-FS (number of pairs = 3; number of up-states = 77), and FS-GIN (number of pairs = 5; number of up-states = 121) pairs, respectively, during down-states. Black lines indicate means of data and shuffled data. Dark and light shading indicate 95% CIs for nonshuffled data and shuffled data, respectively. B1–B3: action potential cross-correlations for the same 3 cell pairings as in A [number of spikes for RS-GIN pairs = 1,764 (RS) and 1,421 (GIN); number of spikes for RS-FS pairs: 1,079 (RS) and 10,471 (FS); number of spikes for FS-GIN pairs = 7,787 (FS) and 2,704 (GIN)]. C1–C3: spike cross-correlations for each heterogeneous cell pairing. CIs were not calculated for RS-FS pairs because n = 3 for this pairing. Number of pairs for RS-GIN = 14; number of pairs for FS-GIN = 5.

