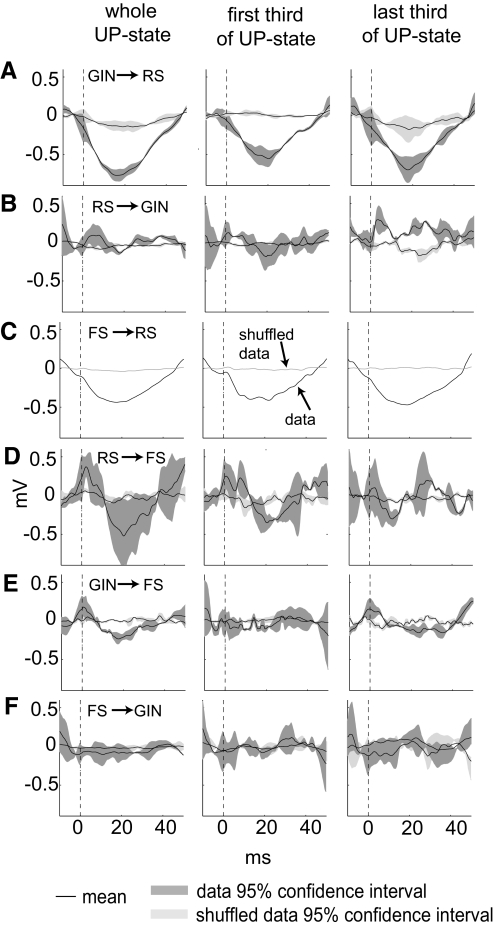
Fig. 7.
Spike-triggered averages for heterogeneous cell pairings during up-states. A–F indicate spike-triggered average membrane potentials for each cell pairing during up-states. First column is spike triggered averages for the entire up-state; 2nd column is for presynaptic action potentials that occurred during the 1st 3rd of the up-state; 3rd column is for presynaptic action potentials that occurred during the last 3rd of the up-states. Lines and shading as in Fig. 6. Numbers of pairs analyzed (number of spikes in whole up-states, 1st 3rd and last 3rd): GIN → RS: 4 (889, 336, 215); RS → GIN: 3 (322, 107, 34); FS → RS: 1 (2,169, 738, 324); RS → FS: 3 (503, 204, 67); GIN → FS: 5 (5,393, 1,629, 2,286); FS → GIN: 5 (6,056, 2,581, 1,089).

