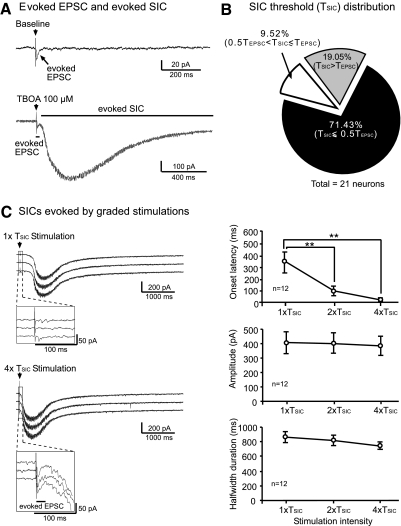
Fig. 2.
Peripheral synaptic input elicits SICs in the presence of TBOA. A: original recordings show the average of 3 responses to electrical stimulation (marked by arrows) applied to the spinal dorsal root entry zone at 2× the EPSC activation threshold (2× TEPSC) at baseline and after perfusion of 100 μM TBOA. An EPSC was evoked at baseline (top). In the presence of TBOA, a novel SIC was evoked by the same stimulation (bottom). B: percentage distribution of stimulating intensities needed to activate SICs (TSIC) relative to those needed to activate EPSCs (TEPSC) in the same neurons (n = 21). C: original recordings show SICs evoked by stimulation of spinal dorsal root entrance at graded stimulation intensities (1× and 4× TSIC). Three sweeps of recordings show 3 SICs evoked by the same stimulation intensity given every 60 s. The enlarged insets show that EPSCs were evoked by 4× TSIC but not by 1× TSIC. Lines and scatterplots show the effect of the stimulation intensities (1× to 4× TSIC) on the mean (±SE) onset latency, peak amplitude, and half-width duration of the stimulation-evoked SICs. The average of 3 responses to consecutive stimulation was calculated. Significant differences between the SIC latency evoked by stimulation at 1× TSIC and at 2× or 4× TSIC,are indicated by *. **P < 0.01.

