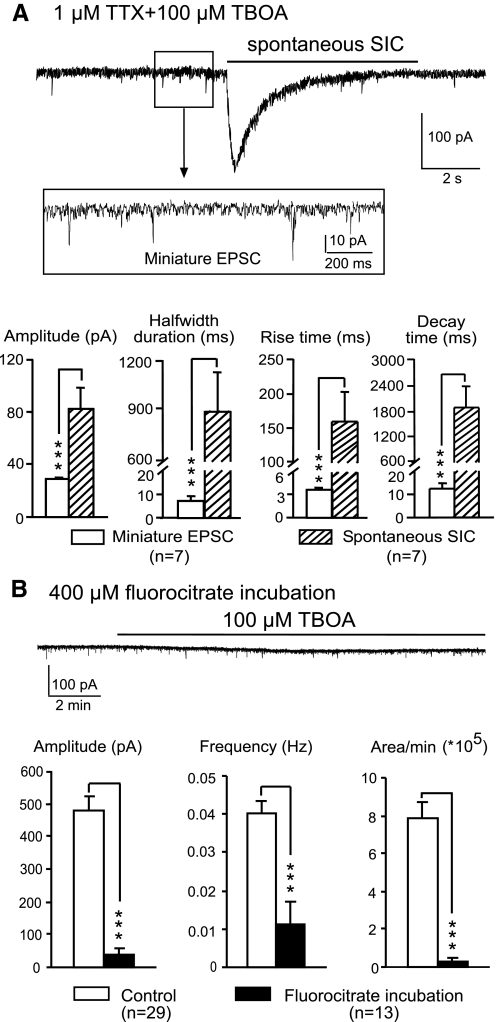
Fig. 4.
SICs are caused by glutamate released from glial cells. A: an original recording showing a sample of spontaneous SICs induced by 100 μM TBOA in the presence of 1 μM TTX and 0 Mg2+ at 20°C. Miniature EPSCs are shown in the enlarged inset. Comparisons of the mean (±SE) amplitude, half-width duration, and rise and decay times of both the SICs and miniature EPSCs collected at the same time are shown in the bar graphs. ***P < 0.001. B: an original recording showing that 100 μM TBOA did not induce spontaneous SICs in a neuron from a slice treated with 400 μM FC. Bar graphs show that the mean (±SE) amplitude, frequency, and areas of spontaneous SICs per minute recorded in neurons from FC-treated slices were significantly lower than those from untreated slices. ***P < 0.001.

