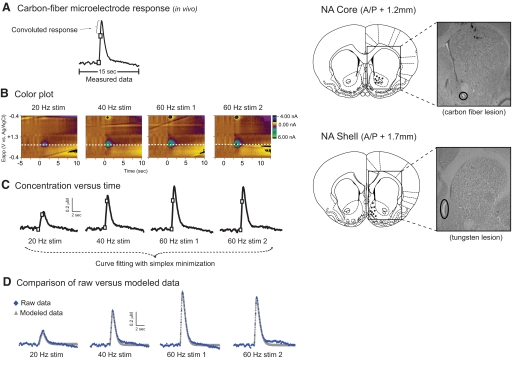
Fig. 1.
In vivo rapid dopamine overflow at the carbon-fiber microelectrode. A: dopamine overflow in the nucleus accumbens (NAc) shell after electrical stimulation of the ventral tegmental area (VTA). At high stimulation frequencies, a continual rise in dopamine concentration even after the stimulation has ceased (2nd white box on trace). This slowed, or convoluted, response is caused by the kinetics of the electrode response time and can be accounted for using a mathematical algorithm. B: predrug rapid dopamine responses at multiple stimulation frequencies represented in a 3-demenisional image in which current is indicated in false color. C: dopamine concentration vs. time plots obtained using the 0.6-V current (dashed line in B) associated with the oxidation of dopamine and calculated using postcalibration values. A simplex minimization algorithm was used to determine values for [DA]p, Vmax, and Km. D: comparison of modeled data (obtained with simplex minimization) to data measured in vivo.

