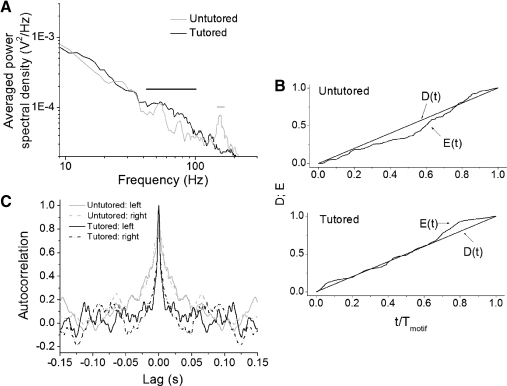
Fig. 6.
Analysis of the activation patterns of vS syringeal muscles. A: averaged power spectral density of the tutored (black) and untutored (gray) birds. The black horizontal line indicates the region where the signal power of the tutored group is significantly greater than that of the untutored group (40–100 Hz), and the gray line indicates significantly greater power in the untutored group (140–180 Hz). B: cumulative analysis of variations for 2 representative examples of the activation pattern during the motif for the tutored (bottom) and untutored birds. The time is normalized to the duration of the motif. The quantifier D(t) represents the ratio of the cumulative activity of the muscle up to time t if the EMG activity were uniformly distributed over the motif, and E(t) corresponds to the actual ratio of cumulative activity of the muscle up to time t. This allows a quantification of how much the distribution of the muscle activity deviates from a uniform distribution across the motif. C: representative examples of the autocorrelation function of the vS muscles for tutored (black) and untutored (gray) birds. Tutored birds switch more frequently between high and low levels of activation.

