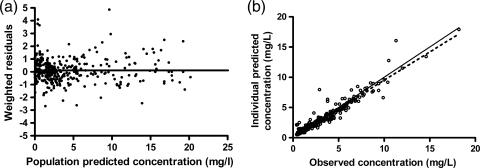
FIG. 1.
Goodness-of-fit plots for the final pharmacokinetic model. (a) Population predicted concentrations (mg/liter) versus weighted residuals; (b) individual predicted concentrations versus observed concentrations. The black dotted line is the line of linear regression with an R2 value of 0.91, and the gray unbroken line is the line of x equal to y.

