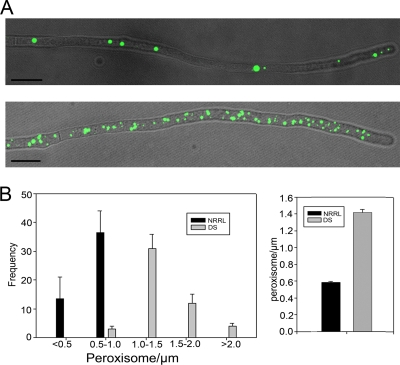
FIG. 3.
Strains with enhanced PEN production contain increased peroxisome numbers. (A) Fluorescence microscopy images showing the peroxisome abundance in a hypha of a low-PEN-producing strain (NRRL1951) (top) and high-PEN-producing strain (DS17960) (bottom) grown under PEN-inducing conditions. Peroxisomes are marked by GFP-SKL. The pictures show overlays of bright-field and fluorescence images. Scale bars represent 10 μm. (B) Quantitative determination of peroxisomes marked by GFP-SKL in NRRL1951 and DS17690. Fluorescent spots were counted from grouped z stacks taken from randomly selected subapical cells by confocal laser scanning microscopy. (Left) Distribution pattern of peroxisomes in both strains. (Right) Average number of organelles per μm hypha. For each sample, at least 50 hyphae were counted. The error bars represent the SEM.

