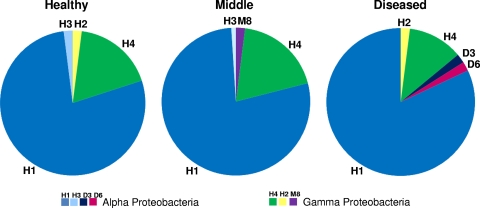
FIG. 4.
Pie charts showing the differences in bacterial community composition in I. basta between healthy control sponges, the interface between the lesion and healthy tissue (middle), and lesion tissue (diseased). The graphs were constructed based on the frequency of clones from each of the three libraries. Clones given the same label in each of the three libraries had identical 16S rRNA sequences.

