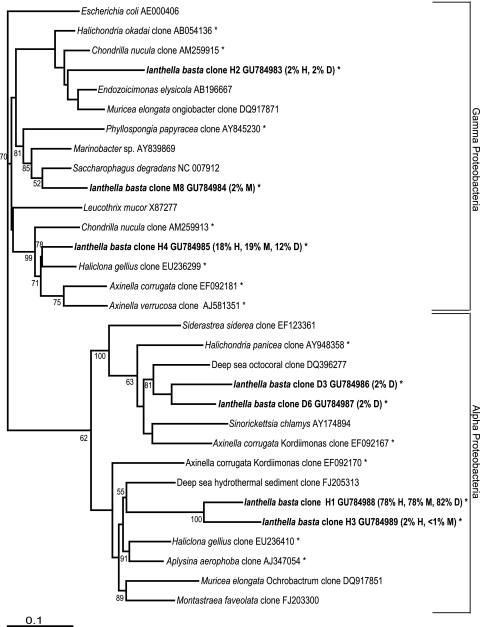
FIG. 5.
Maximum-likelihood phylogenetic tree from analysis of all 16S rRNA gene sequences retrieved from clone library analysis. I. basta sequences are indicated by boldfacing, with the percentage of each library it comprised listed in parentheses afterward, and asterisks (*) indicate clones isolated from marine sponges. The numbers at the nodes are percentages, indicating the levels of bootstrap support based on analysis of 1,000 resampled data sets. Only values >50% are shown. The scale bar represents 0.1 substitutions per nucleotide position.

