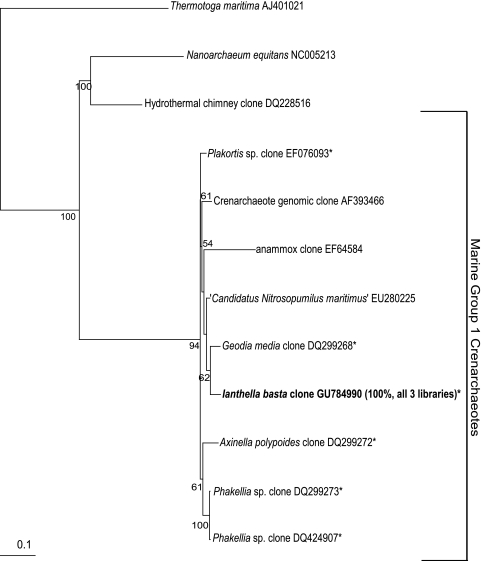
FIG. 7.
Maximum-likelihood phylogenetic tree from analysis of the 16S rRNA gene sequence retrieved from archaeal clones. The I. basta sequence is indicated by boldfacing, and asterisks (*) indicate clones isolated from other marine sponges. The numbers at the nodes are percentages indicating the levels of bootstrap support based on analysis of 1,000 resampled data sets. Only values >50% are shown. Scale bar represents 0.1 substitutions per nucleotide position.

