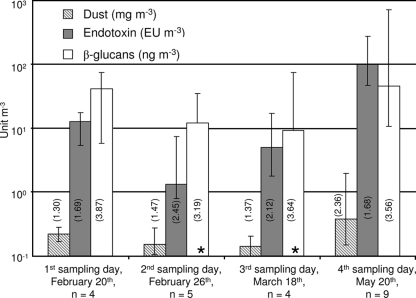
FIG. 1.
Exposure to dust, endotoxin, and β-glucans (personal samples). Note that units differ for each parameter. Columns show median exposures, bars show ranges, and multiplicative standard deviations are shown in parentheses. Asterisks indicate that the lowest value of exposure was below the detection level (4 ng m−3).

