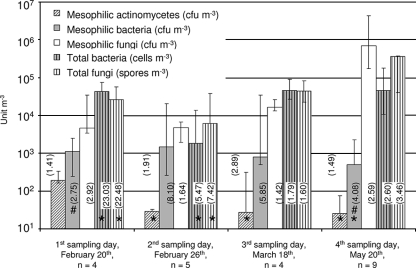
FIG. 2.
Exposure to actinomycetes, bacteria, and fungi (personal samples). Columns show median exposures, bars show ranges, and multiplicative standard deviations are shown in parentheses. Asterisks indicate that the lowest exposure was below the detection level (mesophilic actinomycetes and mesophilic bacteria, 40 CFU m−3; total bacteria and total fungi, 500 CFU m−3). #, data from Hansen et al. (19).

