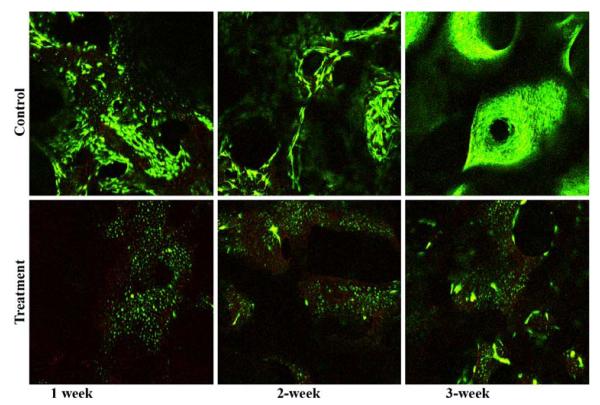
FIGURE 1.
Live/dead viability stains at different time points focused on the center region of vertical sections of explants: top = control and bottom = rinse-trypsinization-rinse treatment. A minimal number of surface cells were present even after 3 weeks culture in the treatment group while the surface of control samples was populated with cells.

