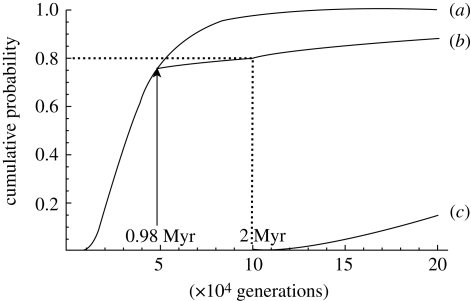
Figure 1.
The probability of TMRCA smaller than t for a sample of 60 DNA sequences at a locus; see eqn (7) in Takahata & Nei (1985) and note that the exponent in eqn (7b) should contain a minus sign. The curves (a), (b) and (c) represent the case of Ne = 104 throughout, the case of Ne = 104 for t < tb and 105 for t ≥ tb where tb = 0.98 Myr, and the case of Ne = 105 throughout, respectively. The generation time is assumed to be 20 years.

