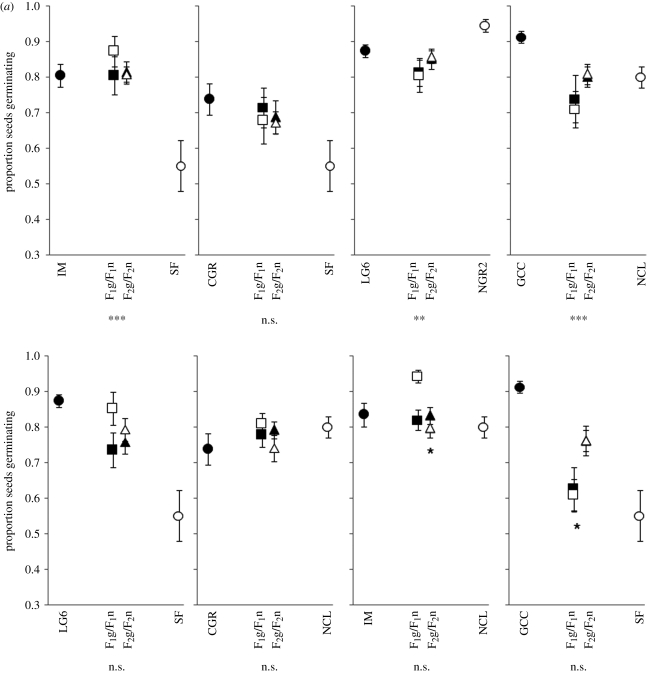
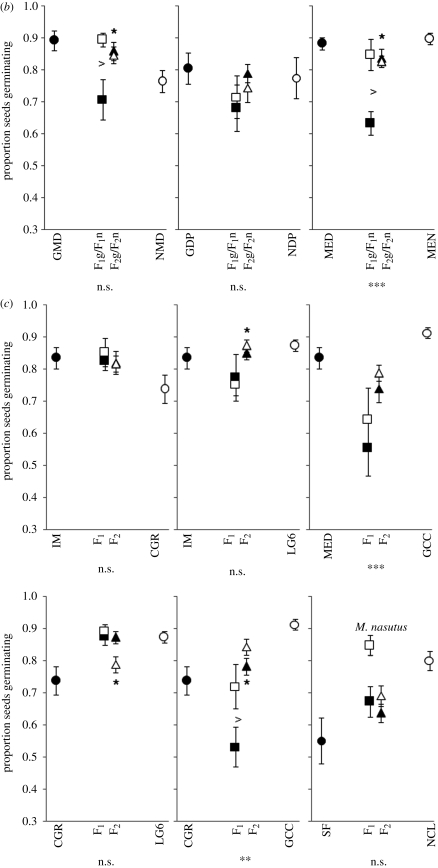
Figure 3.
Pollen viability for (a) interspecific allopatric, (b) interspecific sympatric and (c) intraspecific crosses. Asterisks below the individual graphs indicate that the combined hybrid classes revealed significantly higher or lower pollen viability than the midparent (linear contrasts). Asterisks above or below the F2 hybrid means indicate that the F2 hybrid class deviated significantly from additive-dominant expectations. n.s., not significant; *p < 0.05; **p < 0.01; ***p < 0.001. The fill-colour of hybrids indicates that the cytoplasmic material corresponds to the parent having the same fill-colour. Circles represent pure-species populations, squares represent reciprocal F1 populations and triangles represent F2 populations.


