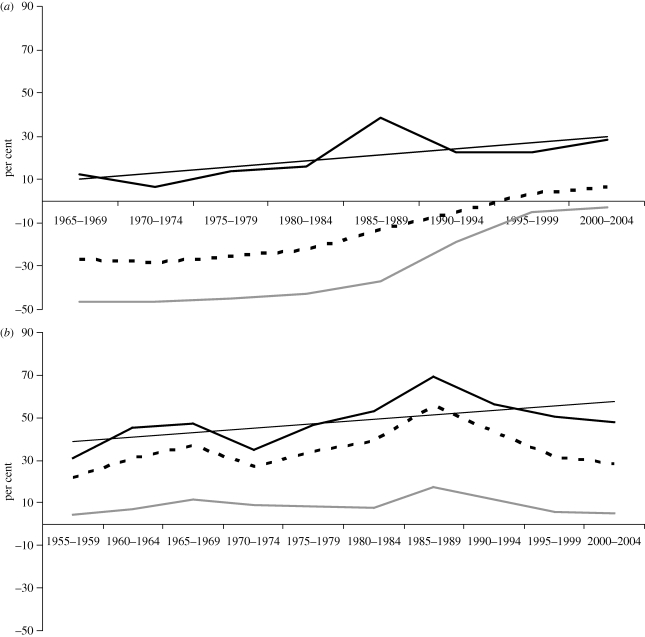
Figure 3.
Nominal rates of assistance to exportable, import-competing and all covered agricultural products (covered products only, and the total also includes non-tradables), HICs and developing countries, 1955–2007. (a) Developing countries. (b) HICs plus Europe's transition economies. From Anderson (2009, ch. 1), based on estimates in Anderson & Valenzuela (2008). Black lines, import competing; grey lines, exportables; dashed lines, total.

