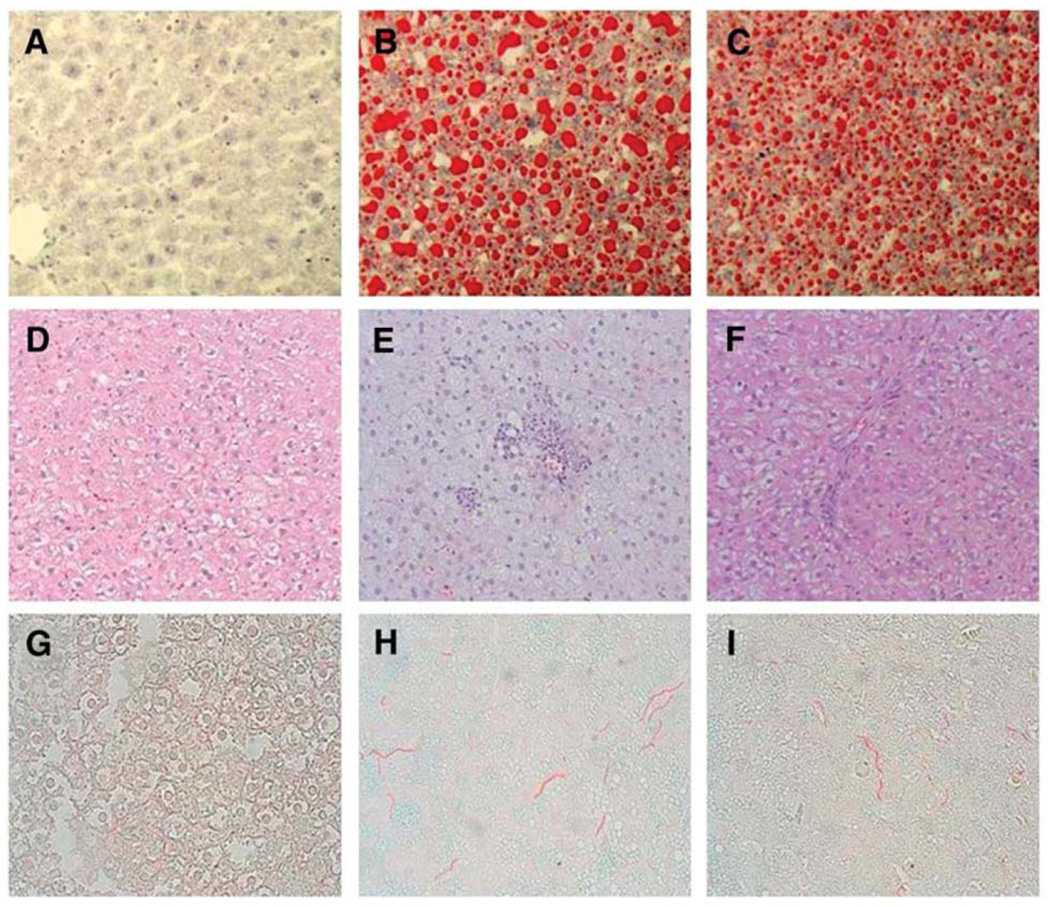
Figure 1. Representative Oil Red O (A,B,C), H&E (D,E,F) and Picosirius Red (G,H,I) stained liver sections from male rats overfed high fat diets with or without NAC supplementation.
Representative Oil Red O stained liver sections: panels (A) C; (B) HF; and (C) HF + NAC (×20 magnification). Representative H&E-stained liver sections: panels (D) C; (E) HF; and (F) HF + NAC (×10 magnification). Representative Picosirius Red stained liver sections: panels (G) C; (H) HF; and (I) HF + NAC (×10 magnification).

