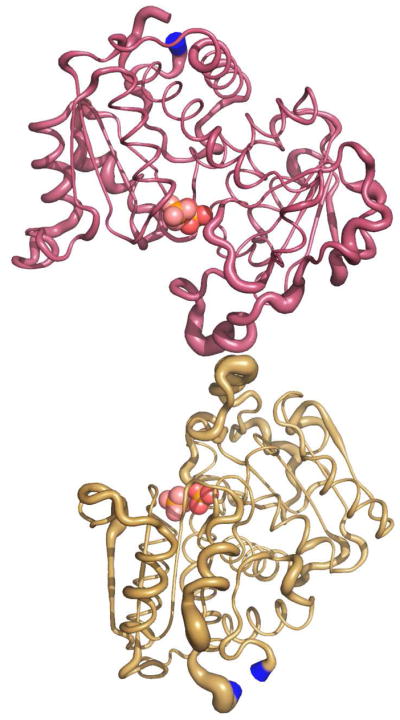
Figure 8.

Comparison of the c6_Pi and RPALA structures. Comparison of one catalytic chain from the upper catalytic trimer, C1 maroon, and the corresponding catalytic chain from the lower catalytic trimer, C4 gold, from the c6_Pi and RPALA structures. The width of the tube is proportional to the RMS deviation between the α-carbon positions of the c6_Pi and RPALA structures. Regions colored in blue represent a RMS deviation greater than 1.0 Å. The two Pi molecules bound at the active site are shown as spheres distinguishable by the different coloring of the oxygen atoms. This figure was drawn using PyMOL.
