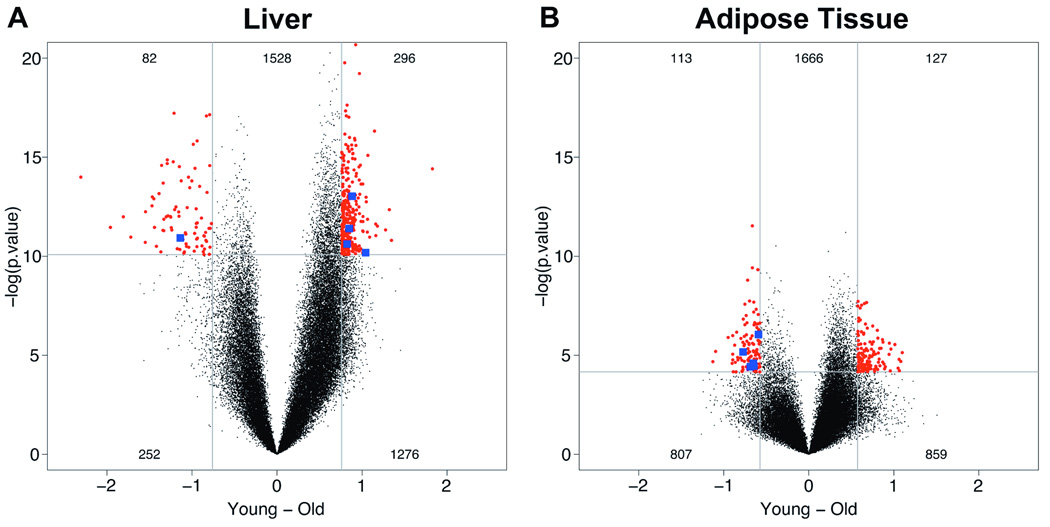
Figure 2. Volcano plot representation to assess age-related changes in global DNA methylation measured by HELP.
Volcano plots reveal differences in DNA methylation with age that are highly dependent upon the tissue in which they are found, liver (A) and adipose tissue (B). Every locus analyzed corresponds to a dot, showing the average differences between young and old (on x-axis, values below zero represent loss of methylation with increasing age, above zero hypermethylation with increasing age) with negative log-transformed significance (p-values) along the y-axis. Thresholds were determined from the magnitude of methylation or significance differences as ≥95th percentile of values. Red dots indicate those loci exceeding both the magnitude of difference and significance thresholds and therefore correspond with the most consistent differentially-methylated sites. Blue-labeled loci are those that exceed threshold values in both the liver and adipose tissue datasets.

